


Background
Every few years, a piece of academic research comes along that genuinely changes how thoughtful investors should think about markets. Professor Hendrik Bessembinder’s work is one of them. His landmark 2017 paper, Do Stocks Outperform Treasury Bills?, delivered a finding so counterintuitive that it made headlines far outside academia. In March 2026, he extended that work into its most comprehensive form yet: One Hundred Years in the U.S. Stock Market, covering every publicly traded US stock from 1926 through 2025. The results are striking, and the practical lessons for individual investors are unusually clear.
Date Overview
Bessembinder examined 29,754 common stocks listed on the NYSE, AMEX, and Nasdaq over the full century from 1926 to 2025. For each stock, he calculated two things: the total percentage return earned by an investor who bought and held the stock throughout its entire listed life, and the actual dollar wealth it created or destroyed for shareholders. Together, these two lenses tell a story that neither could tell on its own.
Exhibit 1: US Stocks vs. T-Bills vs. Inflation (1925–2025). $1 invested in 1925 grew to $14,053 in the US market, vs. $34.59 in T-Bills and $18.12 consumed by inflation.
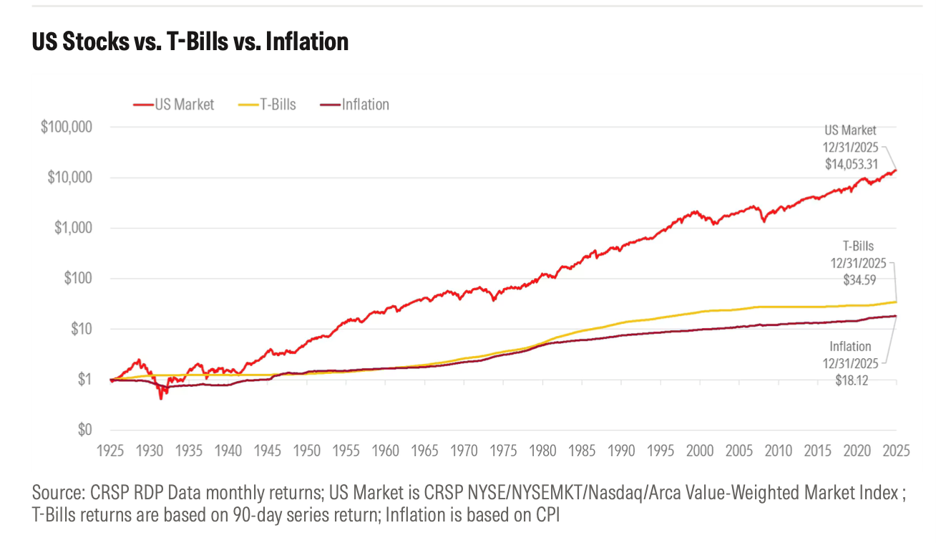
That line chart tells the most encouraging version of the story: invest in the whole US market, hold on through every crash and crisis, and $1 becomes $14,000 over a century, vastly outpacing both Treasury bills ($34.59) and inflation ($18.12). But the aggregate market return hides something crucial. It is pulled upwards by a tiny group of extraordinary stocks. Once you look at what happened to individual stocks, the picture changes dramatically.
Core Findings
1. The Stunning Gap Between Mean and Median
Here is the number that stops people cold when they first see it:
- The average (mean) buy-and-hold return across all stocks exceeded 30,000%.
- Yet the median stock return was just minus 6.9%.
How can the average be over 30,000% while the typical stock lost money? Because a handful of extraordinary companies, including Apple, Microsoft and Exxon in its prime, among a few others, returned so much that they pulled the average into the stratosphere. The median, which simply asks, “What did the stock in the middle actually return?”, cuts through that distortion. The honest answer is that most stocks quietly lost ground.
2. Most Investors Lost Money
Of the nearly 30,000 stocks in the study, close to 60% left long-term holders worse off, not merely by underperforming, but by losing money in absolute terms. If you had randomly selected a stock at any point over the past century and held it for its entire listed life, the odds were against you. You would have been better off simply putting your money in Treasury bills and accepting the risk-free rate. This is not a fringe outcome. It is the most common one.
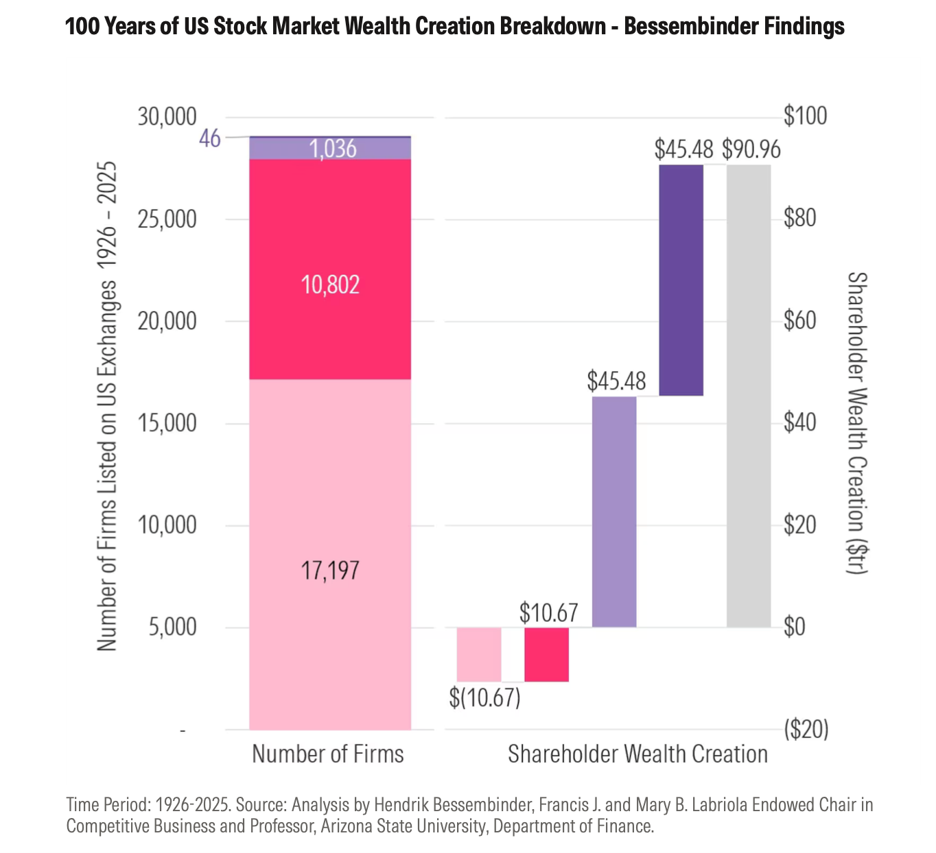
Exhibit 2: Wealth Creation Breakdown (1926–2025). Of 29,085 firms, only 46 (top purple) created half of all $90.96 trillion in net wealth. The 17,197 firms in light pink collectively destroyed $10.67 trillion. Source: Bessembinder, ASU.
3. Extreme Concentration of Wealth Creation
Look at the bar chart above and let the numbers sink in. Of all the wealth created by the US stock market over 100 years:
- The US stock market created approximately $91 trillion in net shareholder wealth over 100 years.
- Just 46 companies account for half of that, roughly $45 trillion.
- Those 46 companies represent only 0.15% of the nearly 30,000 stocks studied.
And this concentration is accelerating. In Bessembinder’s earlier 2018 study, it took 89 companies to account for half the wealth created through 2016. Add just the most recent nine years, and that number collapses to 46. The rise of technology has made the winner-take-most dynamic sharper than ever. The game is not becoming more equal — it is becoming more concentrated.
Exhibit 3: Top Wealth-Creating Companies — 100 Years of US Stock Markets. Bubble size = total wealth created. X-axis = years publicly traded since 1926. Apple (5.52%), Nvidia (5.03%), Microsoft (4.43%), and Alphabet (3.93%) dominate.
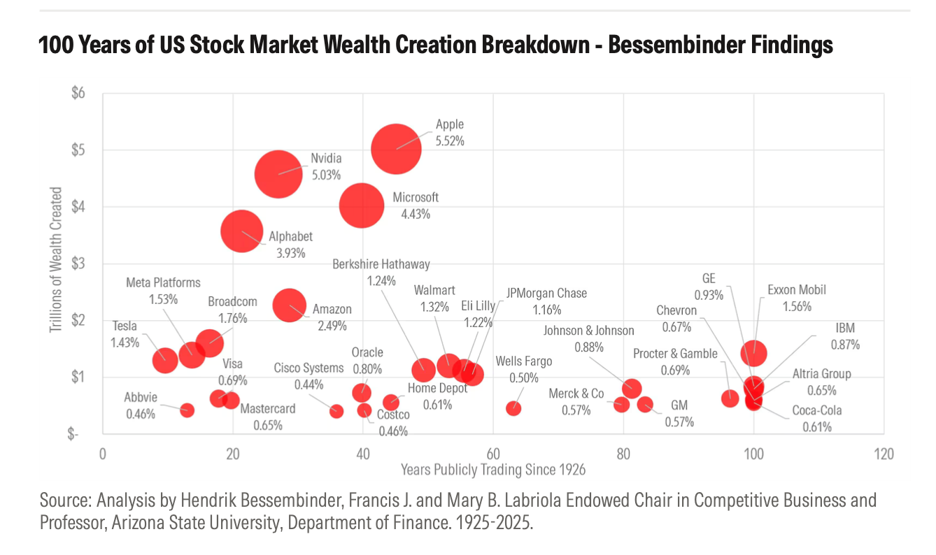
Look at those bubbles. Apple alone accounts for 5.52% of every dollar of wealth ever created in US stock market history, more than $5 trillion from a single company. Nvidia (5.03%), Microsoft (4.43%), and Alphabet (3.93%) are not far behind. Notice something else: all four have been publicly traded for fewer than 40 years. The companies reshaping the wealth leaderboard are young by historical standards, and their impact has arrived fast. This is both exciting and sobering, because it means the next generation of super-winners is almost certainly not yet obvious today.
4. Extreme Skewness: Why the Math Works This Way
To understand why all of this happens, you need to appreciate one mathematical fact about stock returns: they are not symmetrical. Losses and gains do not balance out the way a coin flip does. The asymmetry works like this:
- A stock can lose at most 100%. It can go to zero, but no further.
- A winning stock can return 1,000%, 10,000%, or more. There is no ceiling.
Think of it like a lottery with a twist: most tickets lose, but a very few pay out so enormously that the average payout across all tickets looks attractive. That asymmetry is what makes stock-picking so treacherous and why owning everything is so powerful. Miss the jackpot tickets, and your portfolio looks nothing like the market average.
What This Means for Active Stock-Picking
Here is the uncomfortable truth for anyone who believes in the power of smart stock selection: the maths is structurally stacked against it. If wealth creation is concentrated in 46 out of 30,000 companies, and those 46 are nearly impossible to identify in advance, then any portfolio that holds fewer than the whole market is essentially betting that it has figured out which 0.15% to own. Most of the time, it has not.
The scorecard bears this out. For 16 consecutive years, more than half of professional large-cap fund managers have underperformed the S&P 500. In 2025, that figure reached 79%. These are not amateurs. They are full-time professionals with research teams, access to company management and sophisticated tools, yet they still lose to a simple index the vast majority of the time. The reason is not a lack of effort or intelligence. It is the structural skewness that Bessembinder has documented: miss the rare winners, and no amount of skill elsewhere makes up for it.
Six Practical Recommendations for Individual Investors
1. Embrace Broad-Market Index Funds — Avoid Stock-Picking
The most direct takeaway from Bessembinder’s research is this: stop looking for the needle, and buy the whole haystack. A broad-market index fund, one that tracks the S&P 500, the total US stock market, or a global index, automatically holds every stock. That means you will always own Apple, Nvidia and whatever the next generation of transformative companies turns out to be, even before anyone knows who they are. The moment you start picking and choosing, you risk being on the wrong side of the most important decision in investing: which 0.15% of stocks to own.
2. Diversification Is Your Most Important Risk Management Tool
Individual stocks have a deeply asymmetric risk profile: the most you can lose is 100%, but the most you can gain is theoretically unlimited. That sounds appealing until you realise it works both ways, which means the damage from owning too few stocks and missing the rare winners is severe. Broad diversification is not a consolation prize for investors who cannot pick stocks. It is the strategy that the evidence shows works. The more of the market you own, the higher your odds of capturing the companies that actually drive returns.
3. Beware the Halo Effect of Past Winners
It is tempting, after watching Nvidia return 200% in a year, to load up on Nvidia or to chase whatever sector has recently dominated the headlines. But consider this: in 2010, few people would have predicted that Nvidia, a graphics chip maker, would become one of the greatest wealth creators in stock market history. In 2000, many people were confident about the companies that turned out to be catastrophic failures. The companies that will drive the next century of market returns are probably not the most obvious candidates today. Chasing recent winners is a strategy that feels right but statistically tends not to work.
4. Hold for the Long Term — Avoid Frequent Trading
Frequent trading feels productive. It usually is not. Every trade carries costs, including commissions, bid-ask spreads and taxes on realised gains, but more importantly, every sale creates the possibility of selling a future winner too soon. Bessembinder’s methodology is buy-and-hold for a reason: compounding requires time, and time requires patience. The investors who benefit most from the market’s long-run returns are those who resist the urge to do something and simply stay invested.
5. Do Not Trust Active Fund Track Records
A fund manager who has beaten the market for three years running makes for a compelling story. But the data suggests that such a streak tells you very little about the next three years. When 79% of professionals underperform in any given year, a few will outperform by luck alone, and their track records will look like skill. Before paying higher fees for an actively managed fund, ask yourself: Does this manager have a genuinely repeatable edge, or am I paying for past luck? In most cases, a low-cost index fund quietly outperforms, year after year, simply by avoiding the errors and expenses that come with active management.
6. Take Concentrated Single-Stock Risk Seriously
Many people find themselves holding a large position in a single company, perhaps because their employer compensates them in stock, they have inherited shares, or they bought early and rode a big winner. It feels wrong to sell something that has done so well. But Bessembinder’s data is a useful reality check: the majority of individual companies, over their full listed lives, destroy shareholder wealth. Even the winners of today are not guaranteed to be the winners of tomorrow. If a single stock makes up a meaningful portion of your net worth, that is a risk worth addressing, regardless of how you feel about the company.
Conclusion
One hundred years. Nearly 30,000 stocks. Ninety-one trillion dollars. Bessembinder’s study is the most complete accounting of what the American stock market investing has actually produced — not in theory, but in practice, across every boom and crash, every generation of companies, every technological revolution. The headline finding is counterintuitive but unambiguous: the market as a whole created enormous wealth, but most individual stocks destroyed it. The difference between the two outcomes was captured almost entirely by a tiny handful of extraordinary companies that were, by and large, impossible to identify in advance.
For individual investors, that translates into one clear, actionable conclusion: own the whole market through a low-cost index fund, hold it through the inevitable periods of turbulence, and let time do the work. This is not exciting advice. Markets reward patience and breadth, not activity and conviction. The data from a full century supports this conclusion.
As Bessembinder himself notes, active strategies fail primarily because they are insufficiently diversified. An index fund does not try to be clever. It simply owns everything, and over time, that turns out to be more than enough.
Music courtesy of ItsWatR.
The host of this episode, Isaac Ong, is a Client Adviser at Providend, the first fee-only wealth advisory firm in Southeast Asia and a leading wealth advisory firm in Asia.
Did you know that our Providend’s Money Wisdom podcast is now available in video format on YouTube? Follow us on our YouTube channel for new episodes every Thursday at 8pm.