In recent weeks, there has been a growing crescendo of “bubble talk” by financial market commentators as the S&P 500 continues to make new highs, driven by the spectacular growth of AI related stocks. Undoubtedly, this is because the spectre of the late-1990s technology bubble looms large in the collective memory of investors, creating understandable anxiety when observing today’s market dynamics.
In this piece, we will present our perspective on the topic, corroborating our views with informative exhibits from recent publications released by Goldman Sachs Investment Research and Saxo Bank.
A closer look at the data reveals that while stocks might be richly valued, things are different as compared to the financial conditions around the dot-com bubble.
Equity Valuations Are at Their Highest Levels Since 2000
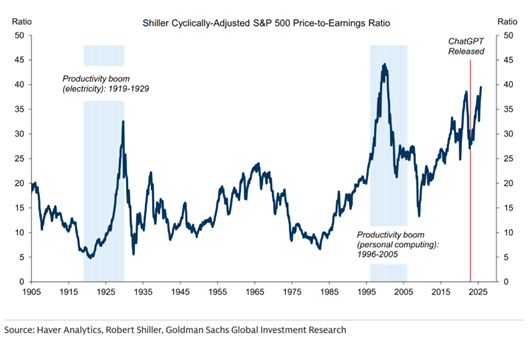
Undoubtedly, one of the key reasons why investors are concerned about a bubble is because equity valuations, particularly in the S&P 500, are at their highest levels since 2000. Going by metrics like the Shiller CAPE, valuations are the highest they have been since the dot-com bubble, surpassing the period preceding the Great Depression.
Tech Sector Concentration in the S&P 500 Is Even Greater Than Dot-Com
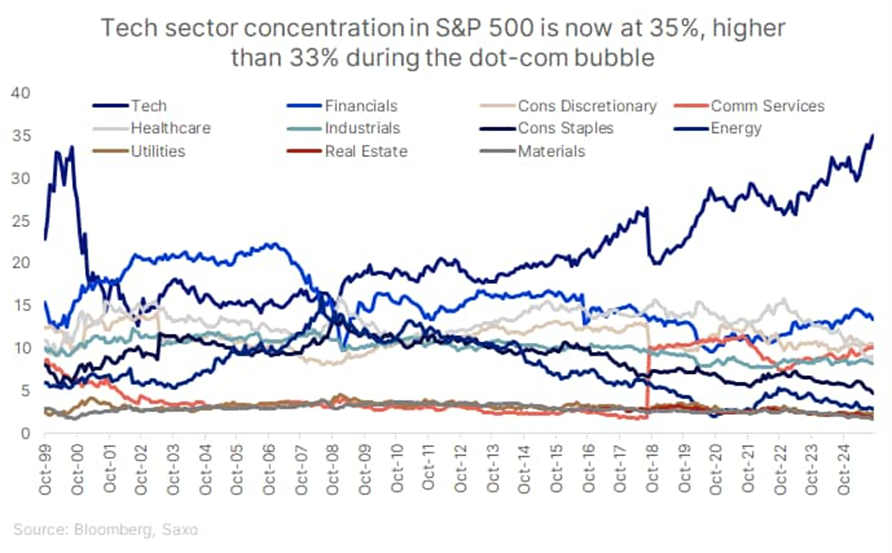
Another metric that has investors worried is that tech sector concentration has now surpassed the Dot-com bubble period. The growth of Nvidia, and other AI hardware providers, along with the growth of the AI hyperscalers like Microsoft, Amazon and Google has driven the concentration of the index in tech to record highs. As this is something similar that happened before the dot-com bubble burst, investors are concerned that the same thing might happen with AI stocks.
A Different Story in 3 Charts
Looking at the data, instead of a bubble, we see that the AI story is currently driven by large profitable corporations spending their cash to build out a business for the future.
Tech Investment Is Growing, but Starting From a High Base
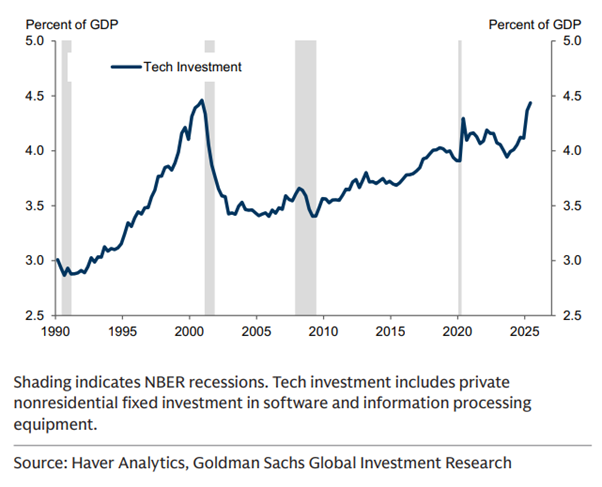
The chart above shows tech investment as a percentage of GDP, and while it has been going up, it has started from a much higher base than in the 1990’s. This is significant because it shows that if anything, the capex into AI so far is not too outsized. A 0.5% of GDP growth in capex from tech is not something that is too extreme. In fact, compared to the investment levels in 2000, the current investment in AI by hyperscalers and other tech firms is much smaller as a percentage of GDP, so if taking indicators from the dot-com era, then we are still some ways away yet, if at all.
Investment as a Share of GDP in AI Is Lower Than That of It and Telcos in 2000
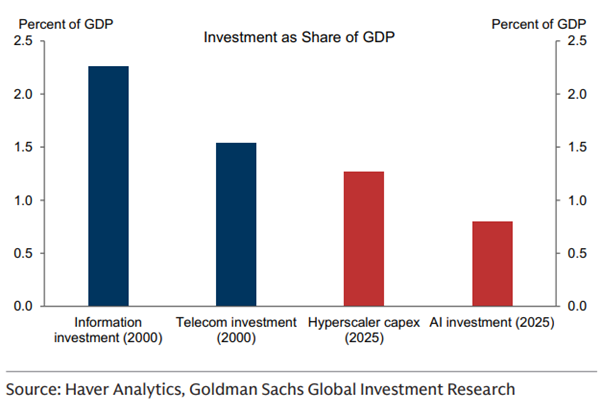
The key difference however between the dot-com period and the current stock market, is that a large part of the stock market performance is driven by companies that are highly profitable, and that these companies have so far mostly funded the capital expenditure out of their massive cash stockpiles.
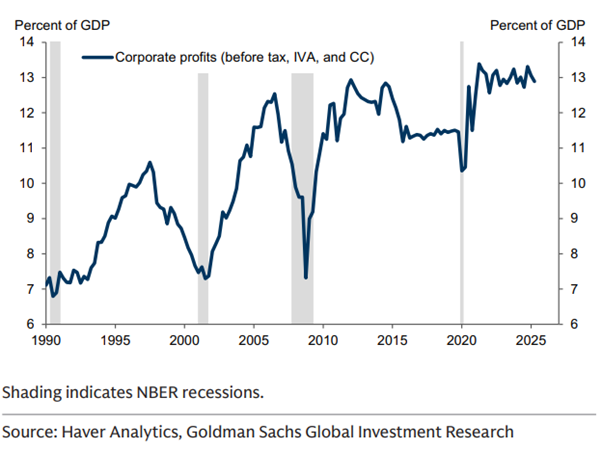
Corporate profits as a percentage of GDP are at levels much higher than during the period of the dot-com bubble so this continues to highlight that companies are still highly profitable, and investors are not chasing the stocks of companies with no product, no sales and just a webpage like in the 1990’s.
Corporate Profits as a Percentage of GDP Remain Very High
A concrete example is how the P/E of Nvidia went from over 150x in 2023 to 50x over the past two years and currently has a forward P/E of 30x. Hence, this highlights that Nvidia’s stock is going higher because it is earning more money due to high demand for its products and services, so stock investors are behaving rationally.
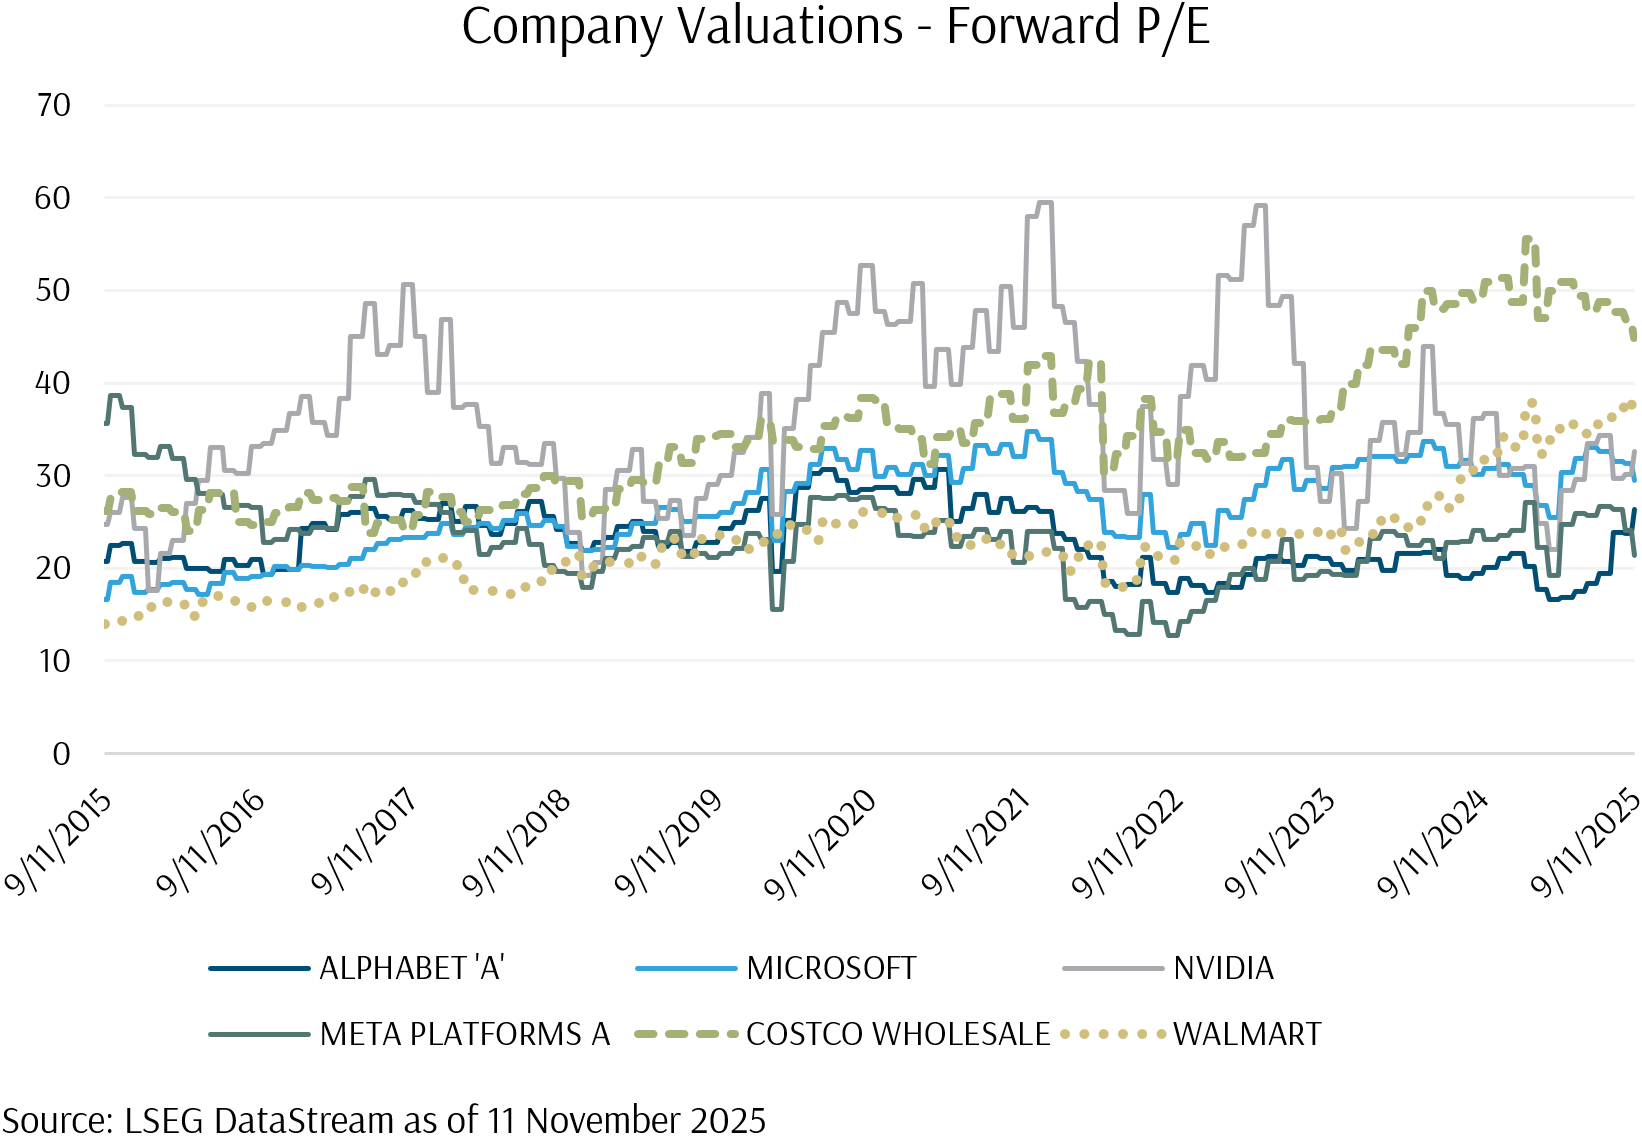
For further perspective, we can take a closer look at valuations under the hood. The following chart shows the forward P/E of 3 major AI-related mega-cap technology companies (Microsoft, Google and Meta), and 2 other non-AI companies (Costco and Walmart). None of the AI-related companies are currently trading at valuations higher than that observed over the past ten years. In fact, both Alphabet (Google) and Meta are trading at reasonable valuation discounts to recent historical ranges. In contrast, Costco and Walmart, which are household names in the US that no investor would associate with AI, are trading at significantly higher valuations while generating considerably lower growth.
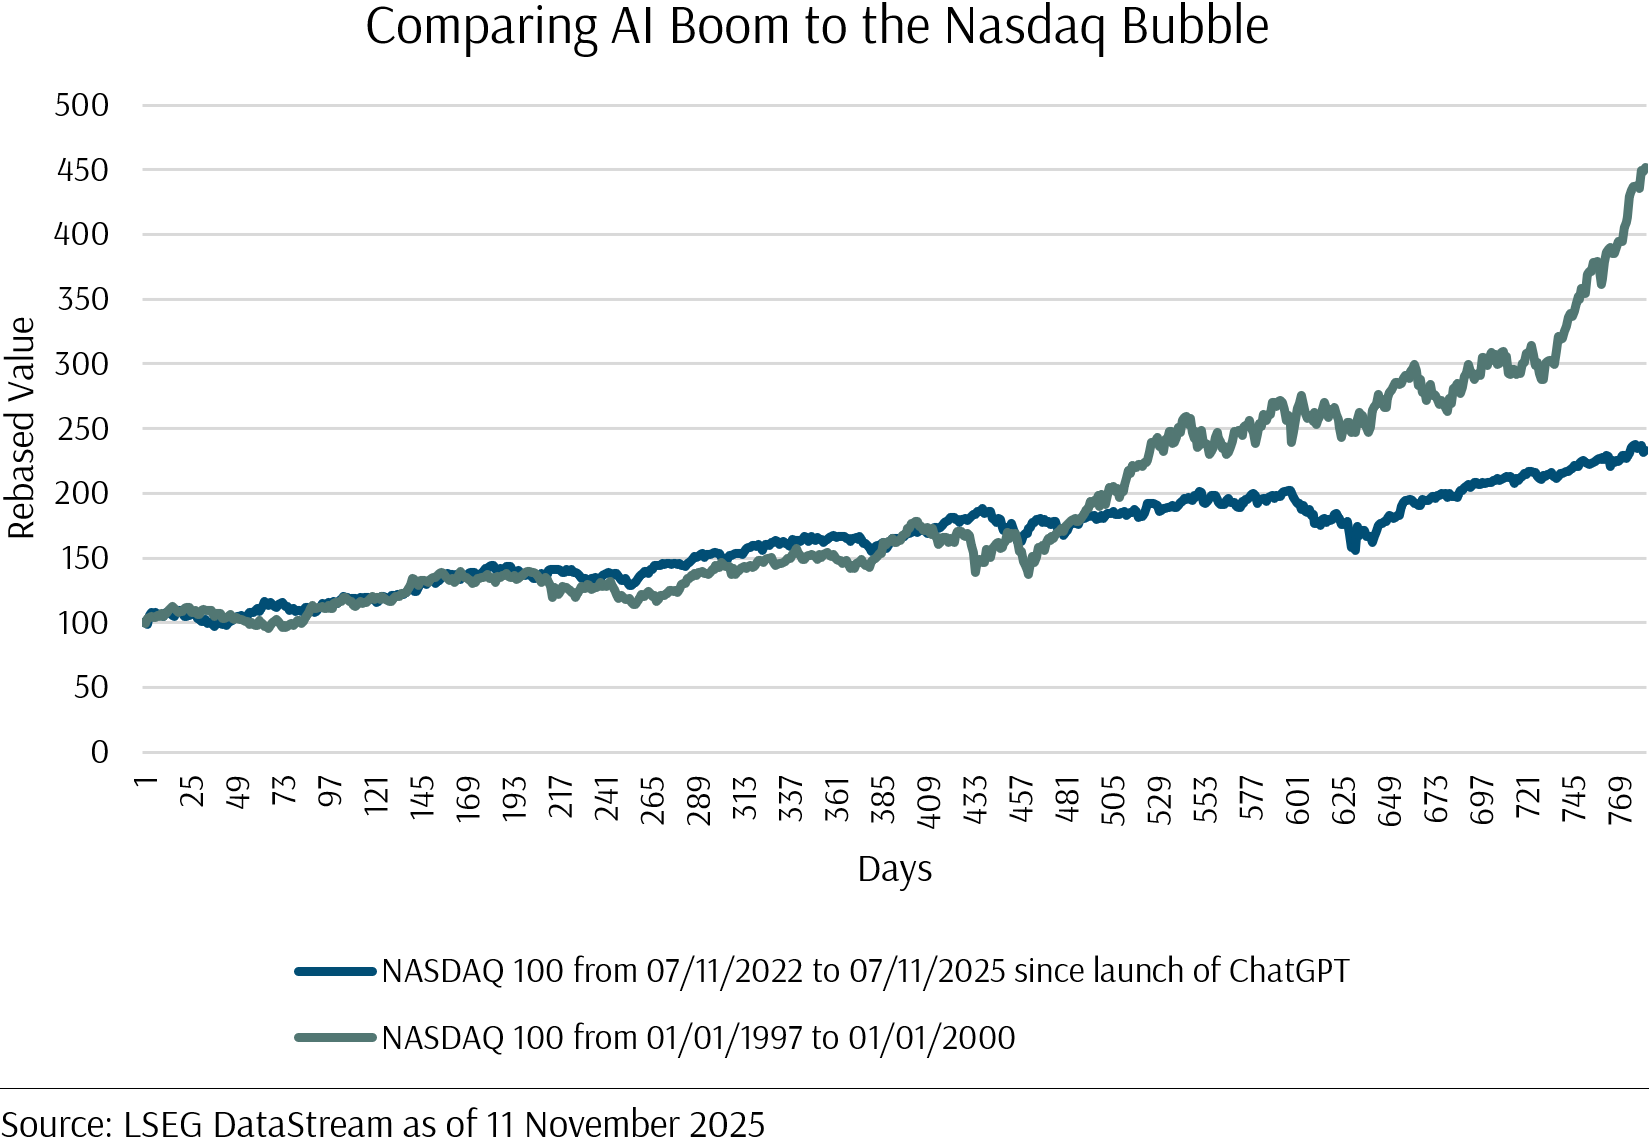
Lastly, in a direct comparison of how the Nasdaq index was looking back during the late 1990’s vs now, it is quite clear that we are no where near the levels of exuberance seen before the Dot-com bubble burst. In terms of how much the Nasdaq has gone up since ChatGPT launched and forever changed how we do research (mostly for holidays), returns fall well short of the extraordinary returns seen from 1997 to 2000.
Nasdaq in Late 1990’s Boom (Green) vs Nasdaq Since the Launch of ChatGPT (Blue)
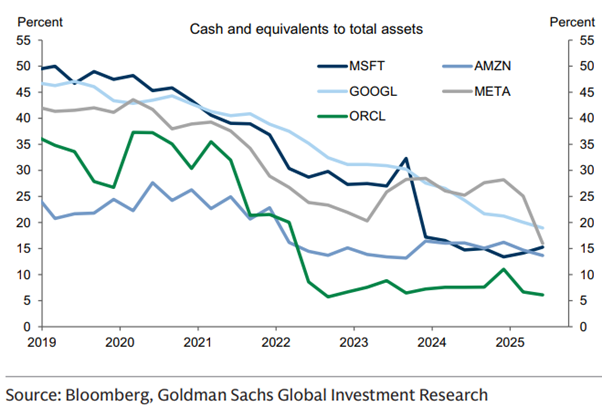
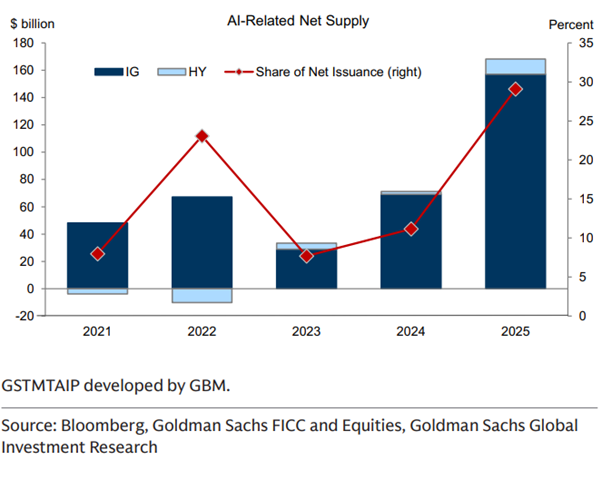
Of course, while current conditions do not mirror a bubble right now, we definitely do see that companies are spending a lot on the development of AI, and it is not entirely clear who will turn out to be the winner of the current AI development and capex cycle. AI hyperscalers have been spending down their cash stockpiles, which has also led them to start issuing more debt to fund the capital expenditure. As the use of debt funding has been a recent phenomenon, company balance sheets remain strong. However, if these companies can’t monetise their AI products at scale or fail to achieve a sufficient return on investment for the large amounts that they are spending to develop the product, write-downs on capitalized assets would be likely, leading to increased balance sheet deterioration.
Cash at AI Hyperscalers Is Falling
Debt Issuance to Fund AI Investment Has Gone up in 2025
In conclusion, while we cannot be sure if we are in bubble territory currently, we can see from the data that the conditions are very different from what preceded the dot-com crash in 2000. Given that a company’s valuation or stock price is ultimately a function of expected future profits, there is no certainty that the share prices of AI hyper-scalers will remain at current levels or rise, should their investments in AI fail to achieve the returns expected by investors. As we are unable to predict the future, we should focus on various parts of the investment and wealth planning process that we can control.
How Providend Portfolios Are Positioned Defensively Against a Possible AI Bubble
At Providend, our portfolios are tilted towards value stocks, which means that on average, our portfolios hold less than the typical index weight of the AI-related stocks, as those stocks are currently trading at much higher valuations. (Do note that these allocations are estimates, and are constantly changing due to market moves, but are broadly around those levels)
MSCI All Country World Index vs Providend Equity Portfolios (Estimated)
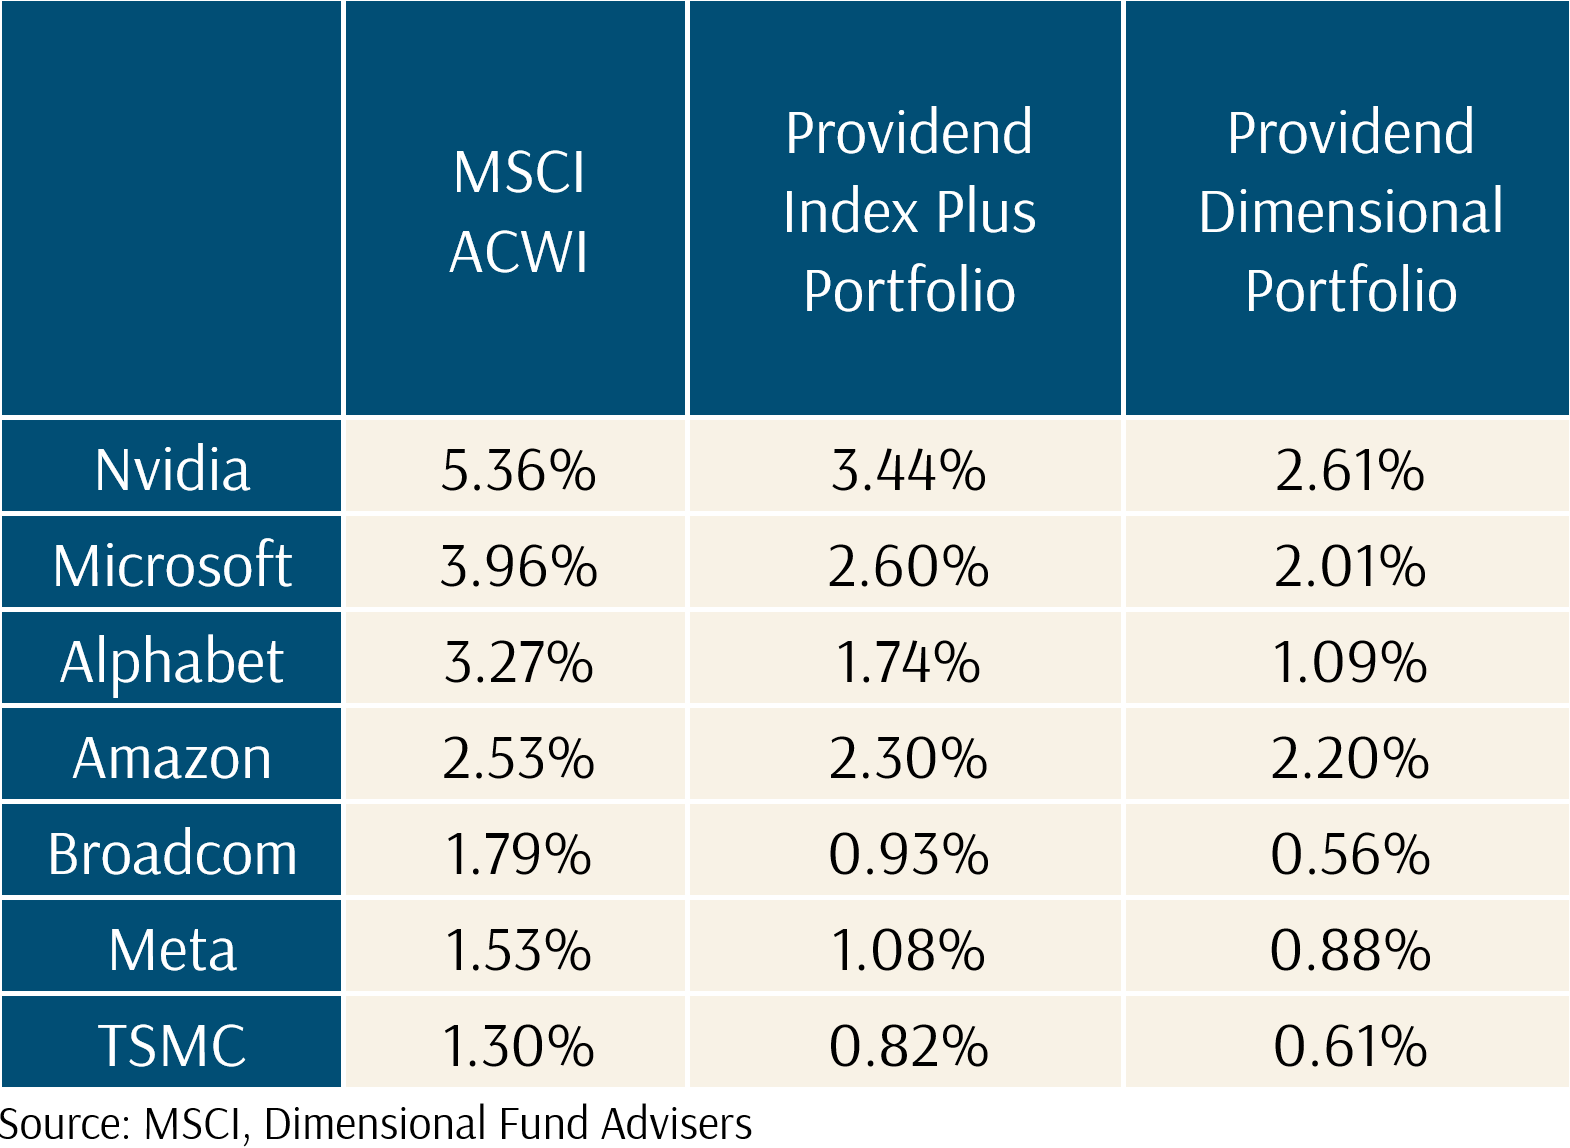
As you can see, by design, our portfolios are holding less of the stocks that are more richly valued, and this is allocated to stocks at a lower relative price across the portfolio.
How this positioning benefits our portfolios should AI be a bubble and crash is twofold
- By holding less of these stocks, our portfolio is not going to fall as much should these stocks crash.
- Our portfolios hold many other stocks at far more attractive valuations, so if there is a crash in these higher valuation stocks, then investors are likely to look for more reasonably valued companies to invest in which will benefit the other companies in the portfolio.
These two factors will help Providend portfolios to outperform should there really be a crash in the AI stocks.
How Your Wealth Plan at Providend Gives You the Peace of Mind to Invest for the Long Term
As a Providend client, our Client Advisers have painstakingly planned your asset allocation and factored in your cash flow needs using our proprietary cash flow planning models. For clients who are in their draw down phase, you would have 5 years of cash set aside for your near-term life goals, along with a conservative allocation for assets that are required within the next 5 to 10 years.
Our conservative allocation is also a strong tool that we can use as either “reserve” for periods where you require more cash, or it can also be used to enhance the growth of your portfolio if market uncertainty subsides and you are able to take more risk.
For clients who are still accumulating, you are in a very good position as you are continually buying into dips with your regular savings plan or top ups as you accumulate towards your future non-negotiable ikigai goals. Your near-term cash flow needs and emergency fund should be parked in cash or near cash.
All this is done in the context of close communication with your adviser who is able to adjust your plan over time through different and changing phases of your life.
This is how our advisory process adds value to give you peace of mind to remain invested even when markets are uncertain.
Tune Out the Noise by Talking to Your Client Adviser
It is understandable to be concerned about your portfolios and your wealth plan as the news headlines are filled with talk about a bubble in AI stocks. However, Providend is constantly working to ensure that our portfolios are robust via our asset allocation choices, and our thorough wealth planning process.
Do contact your Client Adviser for a discussion or a catch up if you have any concerns or questions during this period. Thank you for your continued trust and support.