Executive Summary
- February delivered mixed equity returns, with Asia and EM once again leading decisively while US equities were mixed. The MSCI All Country World IMI rose 1.58%, while the MSCI Emerging Markets IMI surged 5.32%. The S&P 500 slipped 0.38% as large-cap growth stocks continued to underperform, while the Russell 2000 gained 0.68% and the Dow Jones rose 0.25%. Bond yields fell sharply across the globe, with the US 10-year yield declining by 28 basis points. Precious metals were outstanding performers, with gold up 8.49% and silver surging 18.38%, while crude oil rose on geopolitical tensions. The USD strengthened, with the DXY up 1.01%.
- The US-Israel strikes on Iran and the vulnerability of equity markets to correction are the focus of this month’s discussion. We address the nature of the Iran conflict, its transmission to markets via oil prices, and why a globally diversified portfolio with factor tilts remains well positioned to weather geopolitical shocks.
- March has opened with a significant escalation in Middle East tensions following US-Israeli strikes on Iran, driving sharp spikes in oil prices and a rotation into safe-haven assets. While near-term volatility is elevated and the February jobs report has added to growth concerns, the underlying earnings cycle remains intact, value and small-cap factors continue to outperform, and diversified portfolios are proving their worth in precisely the environment they were built for.
February Market Summary
February was a positive month for global equity markets on aggregate, but one characterised by accelerating rotations and sharp dispersion rather than uniform gains. Asian and emerging markets once again led the charge, while US large-cap growth stocks continued their relative decline. The month’s cross-asset dynamics were dominated by a rally in global bonds, a sharp acceleration in precious metals, and a modest firming of the US dollar, setting the stage for what would become an even more volatile March.
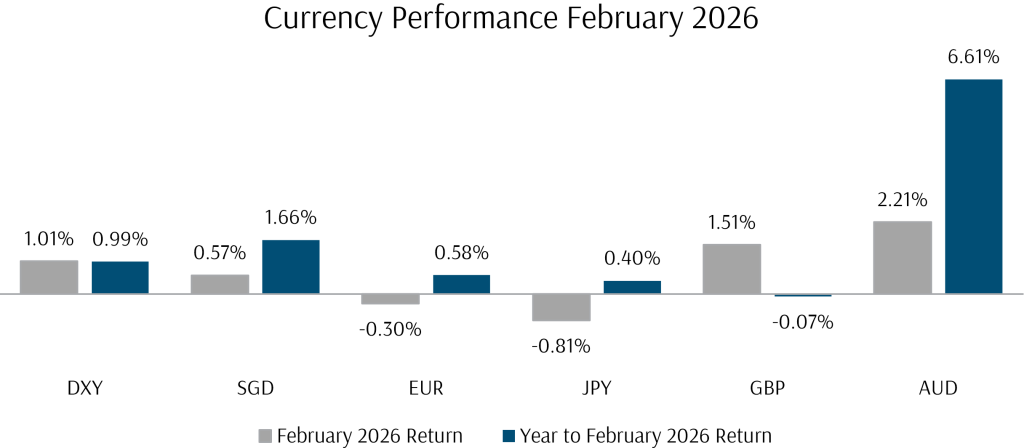
The US dollar regained some ground after its January weakness, with the DXY rising 1.01%, as bearish sentiment gave way to a more balanced outlook following the Kevin Warsh appointment. The SGD appreciated 0.57% against the dollar. Among major currencies, the GBP gained 1.51% and the AUD rose 2.21%, while the EUR slipped 0.30% and the JPY weakened 0.81%. In commodities, it was another month of exceptional precious metals performance, with gold surging 8.49% and silver an astounding 18.38%, driven by central bank buying, geopolitical hedging demand, and ongoing industrial tightness. Crude oil rose modestly, with Brent up 2.53% and WTI gaining 2.78%, as anticipation of potential Middle East escalation began to build into risk premiums.
Global bond yields declined in the month. The US 10-year yield fell 28 basis points, its largest monthly drop in over a year, driven by concerns over the growth outlook, the softening labour market, and a repricing of rate expectations following the weaker-than-expected economic data. Yields fell across all major sovereigns, with the UK 10-year down 29 basis points, the EU 10-year down 20 basis points, and the Singapore 10-year declining 13 basis points. The bond rally provided welcome support for duration-sensitive assets and fixed-income portfolios.
In equity markets, the rotation out of US large-cap growth and into value, small caps, and non-US markets intensified. The Magnificent Seven fell 7.26% in February, while the software sector was down a punishing 9.68%, extending its ongoing de-rating as AI disruption fears persisted. In stark contrast, utilities surged 10.36%, energy gained 9.54%, materials rose 8.40%, and industrials advanced 7.07%. This dramatic sector dispersion was a defining feature of the month and reflected the market’s ongoing recalibration of where the economic benefits of the AI buildout ultimately flow.
Outside the US, Asia continued its remarkable run. Korea’s KOSPI index was the standout, posting an extraordinary 19.52% gain as the semiconductor and technology components boom showed no signs of abating, with DRAM contract prices continuing to surge. Taiwan’s TAIEX gained 10.45%, while Japan’s TOPIX rose an impressive 10.47%, driven by both earnings growth and multiple expansion. Singapore’s STI added 2.07%. Greater China was the weak spot, with the Hang Seng losing 3.67% and the FTSE China A50 down 2.34%, as economic data continued to disappoint and investors rotated away from traditional sectors.
Geopolitical noise, while present throughout February, was overshadowed by market-specific dynamics for most of the month but reared its head sharply as the month drew to a close. Tensions in the Middle East were building beneath the surface, but it was not until the final weekend of the month that the US-Israeli strikes on Iran transformed the geopolitical backdrop entirely, setting the stage for a turbulent March.
Equity Market Performance
US Equities
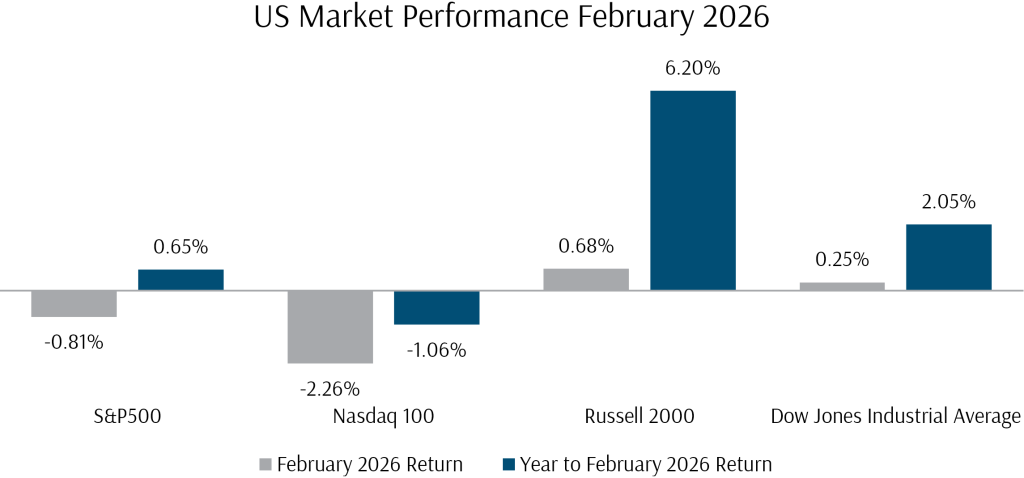
US equity markets were mixed in February, with the S&P 500 falling 0.81% and the Nasdaq 100 down 2.26%, its third consecutive month of losses. Technology sector weakness was persistent and broadening, reflecting mixed earnings reports from large cap tech stocks and accelerating sell-off in the software sector on the back of AI disruption fears.
Elsewhere, the Russell 2000 small cap stock index and other small cap indices maintained their trend of outperformance, with the Russell 2000 gaining 0.68%, showing gains well in excess of benchmark indices, benefiting from the ongoing rotation away from large cap growth stocks. Value-tilted indices continued to outperform as well, with large cap value outperforming large cap growth by a remarkable 5.72% in the month alone.
US macro-economic data was mixed. The ISM Manufacturing Index remained in expansion territory at 52.4, down marginally from 52.6 in January. Meanwhile, the Federal Reserve held rates steady at 3.50% to 3.75%, as expected. Inflation remained somewhat sticky at 2.7%. The February jobs report, released in the first week of March, showed an unexpected loss of 92,000 jobs, the most in four months, with the unemployment rate ticking up to 4.4%, adding to concerns about the health of the labour market.
Exhibit 1: US Stock Market Performance February 2026 (USD)
International Equities
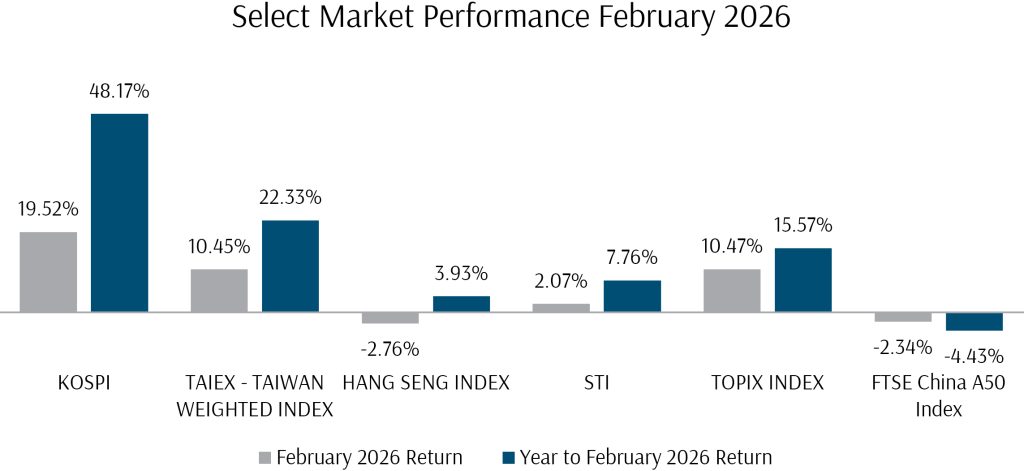
Elsewhere in the world, Asian markets mostly saw strong positive returns, as the ongoing AI capex boom and semiconductor component demand continued to fuel large price rises, particularly in the memory segment.
Accordingly, tech-focused markets gained the most, with the KOSPI index up an extraordinary 20.73% in the month, its strongest monthly performance in recent memory. Taiwan’s TAIEX gained 10.45%, while Japan’s TOPIX rose 8.83%, supported by both earnings upgrades and a broadening of valuation expansion into non-US developed markets. Greater China and Hong Kong underperformed, with the Hang Seng losing 3.67% and the FTSE China A50 down 1.82%, as investors continued to rotate away from traditional economic bellwethers.
Locally, the STI index continued to perform well, with the STI up 1.44%, driven by broad-based contributions from banks, conglomerates, and industrial names.
Exhibit 2: Select Market Performance February 2026 (Local Currency)
Global Summary
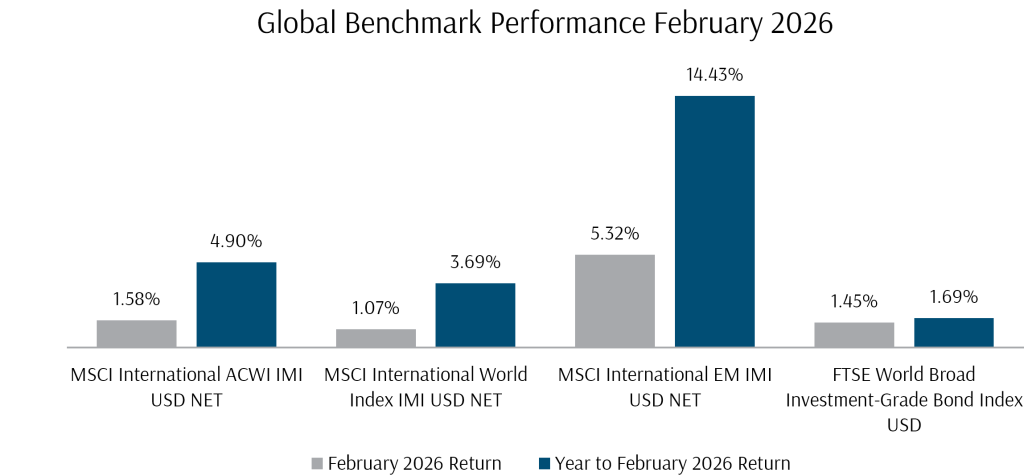
Globally, US market performance, while mixed, was more than offset by outsized gains in Developed Asia and EM. Regardless, February was an excellent month for global equity markets, with the broad MSCI All Country IMI index returning 1.58%.
Exhibit 3: Global Equity Benchmark Index Performance February 2026 (USD)
Cross Asset Performance
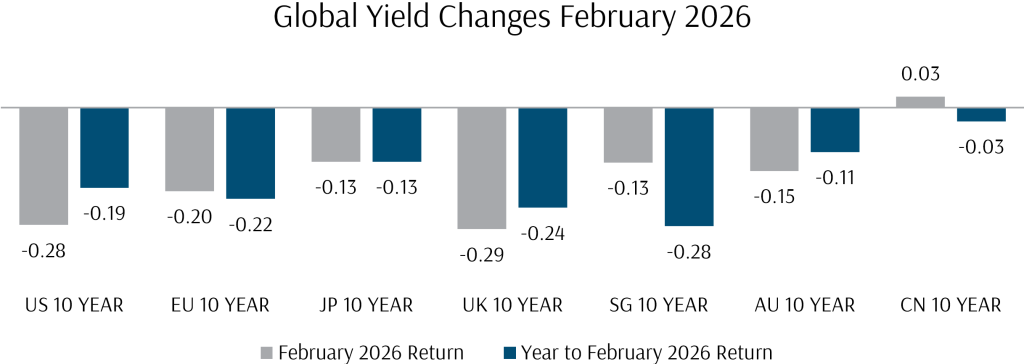
Fixed income markets were notably stronger in February, with core yields finishing sharply lower as the 10-year US Treasury fell 28 basis points to below 4.00%, driven by growing concerns about the economic growth outlook and an increase in safe-haven demand. This was complemented by strong performance in credit and EM bonds, with investment-grade spreads remaining near multi-decade tights.
Overall, the FTSE World Broad Investment-Grade Bond USD Index returned +1.45% for the month.
Exhibit 4: Global Yield Changes February 2026
In other macro markets, activity was measured but building. The US Dollar Index gained 1.01% over the month, reversing part of its January decline. The US dollar gained similar ground against the SGD. The Warsh appointment and a general stabilisation in geopolitical sentiment through the middle of the month supported the greenback, and the late-month escalation in the Middle East introduced fresh uncertainty pushed gains as the US dollar resumed its role as a flight-to-safety asset and as demand for US dollars increased alongside surging prices for dollar-denominated commodities.
Exhibit 5: Currency Performance February 2026
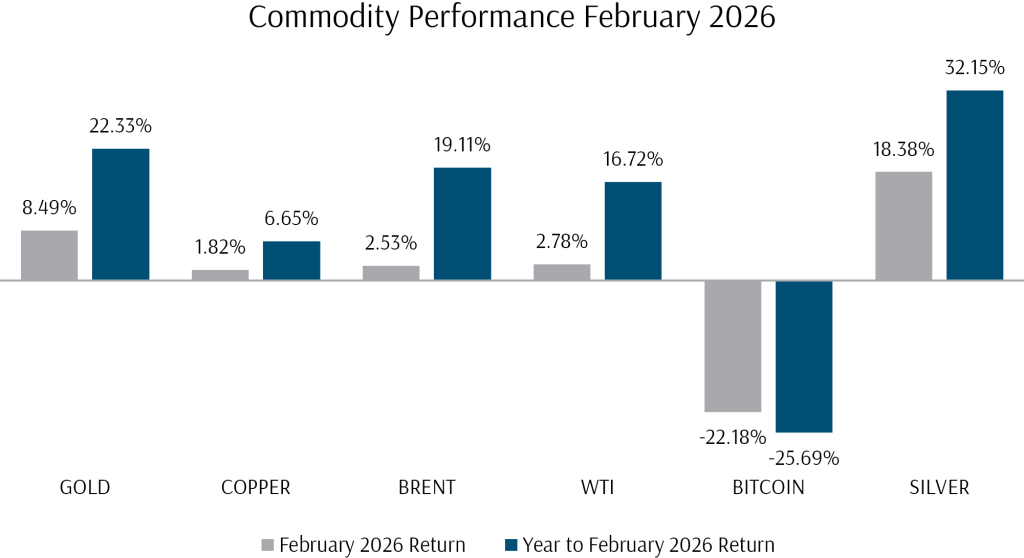
In commodity markets, precious metals were once again the outstanding story. Gold surged 8.49% in February, driven by central bank buying, geopolitical hedging, and a structural shift in demand towards hard assets amid currency and inflation uncertainty. Silver was even more impressive, rising 18.38%, supported by both safe-haven demand and persistent industrial tightness from electronics and solar manufacturing. Crude oil rose modestly earlier in the month, with Brent up 2.53% and WTI gaining 2.78%, as geopolitical risk premiums began to build ahead of the Iran escalation, before decisively moving higher as the first missiles launched. Copper gained 1.82% on continued industrial demand. In stark contrast, Bitcoin fell 22.18%, further undermining the “alternative to gold” narrative.
Exhibit 6: Commodity Performance February 2026
How Did Our Portfolio Funds Do in February?
Exhibit 7: Equity Fund Performance February 2026 (SGD)
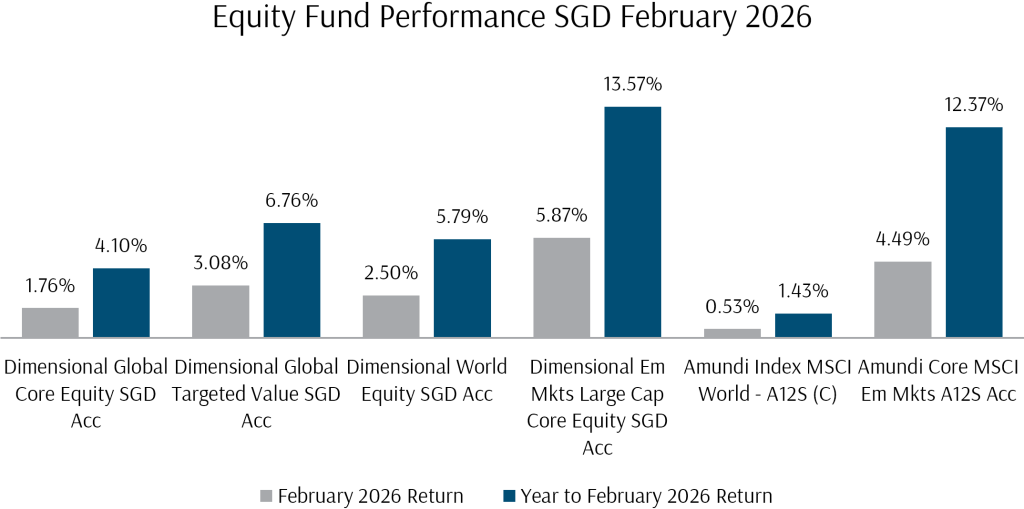
Portfolio fund performances were positive across the board, with outstanding performances from several funds. Equity funds were positive without exception, while fixed income funds also delivered positive returns, supported by falling bond yields.
DFA fund performances continued to impress, as Value and Small Cap factors carried their momentum from late 2025 into the new year. DFA equity funds mostly outperformed benchmark indices, with the Global Targeted Value Fund turning in an outstanding 3.08% return in SGD terms, well ahead of global small cap benchmarks. The Global Core Equity Fund returned 1.76% in SGD terms, more than tripling the performance of the Amundi MSCI World Index Fund, which returned 0.53%. The ongoing outperformance of Value and Small Cap factors was even more salient in February, as noise around AI and technology sector’s earnings and valuations remained elevated and the market rotation into physical assets and value-oriented segments accelerated.
Emerging markets had the biggest returns, with the Amundi MSCI EM fund gaining 4.49% and the DFA EM Large Cap Core Equity Fund gaining 5.87% respectively.
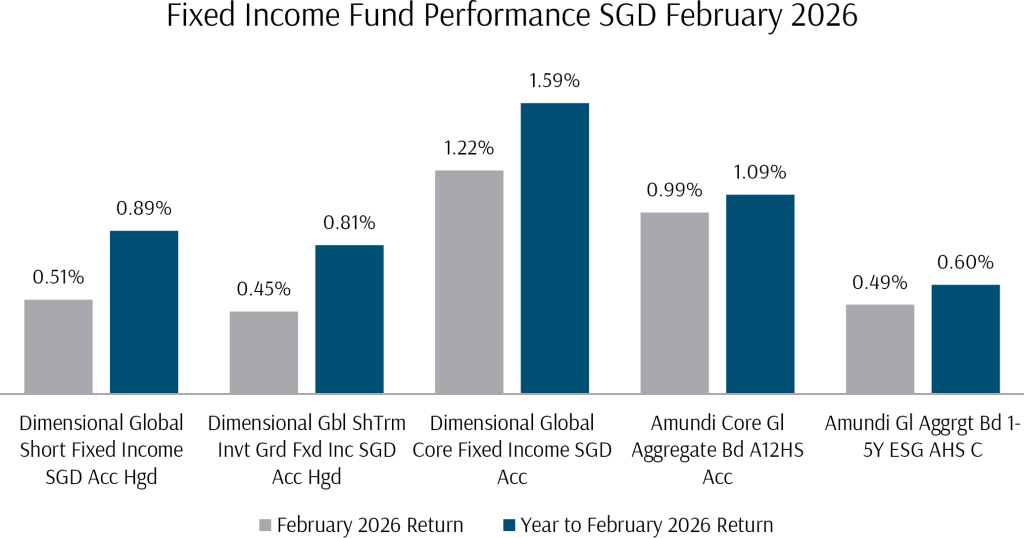
DFA fixed income funds also performed well through February, with the Global Core Fixed Income Fund gaining 1.22% in SGD terms, while the shorter-duration funds returned 0.45% to 0.51%, benefiting from falling yields across the curve.
Investment Questions: The Iran Conflict and the Market Outlook
Q1: What happened with Iran, and how serious is this for markets?
On 28 February, the US and Israel launched joint strikes on Iran in a large-scale operation targeting regime infrastructure and military targets. The Iranian Supreme Leader, Ali Khamenei, was confirmed killed in the strikes, along with several senior officials. Iran’s navy suffered significant losses, and its missile capabilities have reportedly been substantially degraded.
The immediate market reaction was swift but orderly. Oil prices surged, with Brent jumping from around $72 to above $79 per barrel in the days following the strikes. Gold hit new records near $5,400 per ounce on safe-haven demand. The US dollar strengthened, and equity markets experienced sharp intraday volatility before partially recovering.
Since the initial strikes, the situation has developed further. Iran has moved to restrict shipping through the Strait of Hormuz, the critical chokepoint through which approximately 20 million barrels per day of oil normally flow. Tanker traffic through the Strait has fallen sharply, with estimated flows down approximately 90% from normal levels, and there have been several reported attacks on vessels in the area. Pipeline workarounds through Saudi Arabia and the UAE have so far offset only a fraction of the disruption. The key question for markets is how long these conditions persist. As with past geopolitical episodes, the economic significance will be determined by the duration of any supply disruption rather than the initial shock itself.
Q2: How could oil prices and inflation be affected?
Oil is the primary transmission channel from geopolitics to the broader economy and markets. Brent crude has risen from around $72 before the strikes to above $90, and research houses have flagged the possibility of prices moving above $100 per barrel if shipping through the Strait of Hormuz does not begin to normalise in the near term.
The scale of the current disruption is significant. The total reduction in Persian Gulf oil flows is estimated at around 17 million barrels per day, and pipeline alternatives have so far only been able to redirect a small portion of that volume. These figures are large in historical context, and the market is understandably pricing in a meaningful risk premium.
If oil prices settle around current levels and the disruption proves temporary, the economic impact should be manageable. Central banks are expected to look through the shock in their base case, maintaining existing easing trajectories. A more sustained period of elevated prices, however, would add to inflationary pressures and could weigh on growth expectations, particularly for energy-importing economies. The path of oil prices over the next few weeks will be an important signal for the broader market outlook, and we will continue to monitor developments closely.
Q3: What needs to happen for oil markets to normalise?
There are broadly three paths to a recovery in Strait of Hormuz shipping: a broader de-escalation of the conflict, US naval protection for commercial tankers, or Iran permitting safe passage for vessels with certain origins and destinations. Each of these would take time to materialise, and commercial shippers are understandably cautious while physical risks remain elevated.
US policymakers have offered varying timelines, ranging from a few weeks to potentially longer. Major Asian refiners appear to be planning for disruption lasting at least 10 to 15 days. For context, the US Treasury has already taken steps to ease supply constraints, including issuing a waiver for India to continue purchasing Russian oil, and OPEC+ has announced a modest production increase.
It is worth noting that energy markets have navigated supply shocks before, and the combination of alternative supply routes, strategic reserves, and policy responses typically works to moderate the impact over time. That said, while oil prices remain elevated, we would expect continued volatility across equity and bond markets, and investors should be prepared for a period of heightened noise.
Q4: Does this change the outlook for equities?
The oil shock introduces an additional source of uncertainty to a market that was already navigating elevated valuations and a softening US labour market. However, the weight of evidence continues to suggest that the current environment is more consistent with a correction than a sustained downturn.
Several factors support this view. The underlying growth cycle remains solid, with US growth expected at around 2.8% for the year. Earnings growth is robust, with global earnings estimates revised upwards since the start of the year. Private sector balance sheets remain healthy across households, corporates, and banks, providing a buffer against second-round effects.
The key risk is that a prolonged period of elevated oil prices complicates the inflation picture and delays expected rate cuts, which would weigh on rate-sensitive parts of the market. Historically, the median equity correction following geopolitical events has been around 6% over 18 days, with markets typically recovering relatively quickly once the initial uncertainty begins to clear. Any correction in this environment is more likely to present an opportunity than the start of something worse, although the timing is inherently uncertain.
Q5: How does the geopolitical situation affect Asia and emerging markets?
The impact is mixed and depends on the nature and duration of the oil supply disruption. Asian and EM oil importers face the most direct exposure to higher energy costs, which can tighten financial conditions and weaken external balances. India is somewhat insulated given its relatively low oil share in CPI and has received a US Treasury waiver to continue purchasing Russian oil. China has strategic reserves, alternative supply arrangements, and is rapidly electrifying its transport sector. Europe is more sensitive to gas prices but should see conditions normalise seasonally.
At a sector level, energy and defence names stand to benefit from higher commodity prices and increased defence spending, while consumer cyclical sectors may face headwinds from slower demand and rising input costs. Commodity-exporting countries are also well positioned in this environment.
Importantly, the structural trends driving Asian outperformance, particularly the AI semiconductor buildout and improving financial conditions across the region, remain intact. A prolonged oil shock would test these tailwinds, but the underlying investment case for Asia and EM diversification has not changed.
Q6: What does this mean for my portfolio?
In practical terms, the current environment is likely to produce a period of mixed results across asset classes, and it is important to set expectations accordingly.
Equity portfolios may experience short-term drawdowns, particularly if oil prices remain elevated. However, the impact will not be uniform. The rotation into value, small cap, and non-US markets that has been underway since late 2025 has meant that our portfolios have been on the right side of the market’s shift in leadership. These positions provide a meaningful cushion against weakness in US large cap growth, which has borne the brunt of the sell-off.
For fixed income, falling bond yields have been a positive development, supporting the value of our bond holdings. Should the growth outlook deteriorate further, bonds are likely to continue playing their traditional role as portfolio ballast. However, if oil prices drive a resurgence in inflation expectations, the path for bonds becomes less straightforward, as central banks may need to delay rate cuts. Our shorter-duration positioning helps mitigate this risk, as shorter-term bonds are less sensitive to shifts in rate expectations.
While nobody can predict with confidence how long the Strait of Hormuz disruption will last, or where oil prices settle, our portfolios are not concentrated in the areas under the most pressure, and the diversification and factor tilts that are core to our approach have been doing what they are designed to do. There may be periods over the coming weeks where headline portfolio returns look soft, particularly on days when markets react to geopolitical developments. This is normal and expected.
It is equally important, however, not to assume that the current stress persists indefinitely. Geopolitical risk premiums can unwind just as quickly as they build. If shipping through the Strait of Hormuz begins to normalise, whether through de-escalation, naval protection, or diplomatic arrangements, oil prices would likely retrace sharply, and the assets currently under the most pressure would be among the fastest to recover.
We have seen this pattern repeatedly in past geopolitical episodes: the April 2025 trade war shock, for instance, saw markets recover their losses within weeks once the immediate threat receded. Investors who sold into that panic locked in losses that patient investors recovered in full. The same dynamic applies here. While we cannot predict the timing, the resolution of supply disruptions tends to produce rapid and broad-based relief rallies, and portfolios that remain invested are the ones positioned to capture them.
Looking Forward to March 2026
In the first week of March, equities have pulled back across the board, with the S&P 500 down approximately 3% from its February close and the Nasdaq declining around 4%. Oil has been the epicentre of market anxiety, with WTI crude surging above $90 per barrel as disruptions to the Strait of Hormuz intensified. The February jobs report added a fresh layer of concern, with the US economy losing 92,000 jobs, partly attributable to a large healthcare strike, and the unemployment rate ticking up to 4.4%.
Despite the elevated noise, the picture is not uniformly negative. Earnings growth continues to track above expectations, with global estimates revised upwards since January. Value and small cap factors have held firm through the turmoil, and defensive sectors such as utilities, healthcare, and consumer staples have provided support. Notably, the software sector posted its best weekly performance in nearly a year in the first week of March, as mean-reversion trading kicked in after months of relentless selling. Falling bond yields have supported fixed income portfolios, and the combination of eventual rate cuts, pre-midterm fiscal support, and continued strength outside the US provides a constructive backdrop once the geopolitical dust begins to settle.
For now, staying invested and grounded through periods of volatility and exuberance continues to be the most reliable path to growing wealth over time.
With a comprehensive plan already in place with your Client Adviser, covering near-term spending needs while allocating capital at a level of risk suitable for your longer-term goals, you can have the peace of mind to navigate market volatility and stay invested for the long term, allowing your wealth to compound and fulfil your ikigai. If you have any questions, please do not hesitate to reach out to your Client Adviser.
The writer of this market review, Glenn Tan, is Portfolio Manager at Providend Ltd, Southeast Asia’s first fee-only comprehensive wealth advisory firm. He is also a CFA Charterholder and a Certified Financial Risk Manager (FRM).
For more related resources, check out:
1. Active Investing That Adds Value to the Client
2. Staying the Course: Investing With Confidence in Uncertain Times
3. Here’s Why We Charge a Higher Fee Than Robos
Download our Investment eBook titled “A More Reliable Way to Get Enough Investment Returns: Even During Times of Market Uncertainty” here.
With a minefield of financial misinformation out there, we promise to be a safe pair of hands and a second pair of eyes to help you avoid costly financial mistakes. Learn more about our investment philosophy here.
We do not charge a fee at the first consultation meeting. If you would like an honest second opinion on your current estate plan, investment portfolio, financial and/or retirement plan, make an appointment with us today.