Executive Summary
Markets traverse through distinctive macro-economic environments, each shaped by combinations of risk appetite, growth, inflation, and monetary conditions. Using a classification framework built on 20 years of weekly data and investigated across 41 macro indicators/proxies, we identify six such environments and examine their implications for portfolio returns across asset classes.
Our analysis yields two findings that matter for long-term investors. Firstly, approximately 72% of all weekly observations fall in environments that produce positive equity returns. Even in the more volatile period since 2020, the share remains above two-thirds. The market rewards being invested far more often than it punishes it. Secondly, while we can identify the current environment with reasonable accuracy, transitions between environments are often too dispersed to support tactical timing based on macro-economic signals, where the realities of dealing with real-world execution issues often completely eliminate the return advantage of a regime-based trading strategy entirely.
For long-term investors and portfolio managers, the framework’s value extends well beyond the timing question. It provides a coherent explanatory model for the full arc of market history from 2006 to the present, a structured vocabulary for diagnosing market stress in real time, and empirical evidence to evaluate every component of a diversified portfolio against its regime-level track record. These are practical tools that allow for better portfolio design, as well as the building of evidence-based conviction that allows investors to maintain discipline when markets are most unsettling.
Should Investors Always Adjust Their Portfolios When Market Environments Change?
In recent weeks, market conditions have shifted significantly. Geopolitical events have driven volatility spikes, equity indices have pulled back from their highs, and sentiment has swung from confidence to caution. The natural question from investors: should we be doing something?
It is a fair question, and one we hear frequently at Providend during periods of market stress. Behind it lies an observation that most investors recognise instinctively: markets have moods. The calm, steady grind higher that characterised much of 2024 felt qualitatively different from the sharp, fear-driven sell-offs of March 2020 or the grinding, inflation-driven correction of 2022. These are differences in kind, not just in magnitude. They reflect fundamentally different combinations of economic forces acting on financial markets at any given time.
Academics and practitioners refer to these phases as “market regimes”: periods during which the relationships between risk, growth, inflation, and policy behave in largely familiar patterns. A crisis may be characterised by surging volatility, widening credit spreads, safe-haven flows into gold and government bonds, and a general decline in risk appetite. A reflationary environment features rising commodity prices, positive growth, expanding inflation expectations, and accommodative policy. Most investors have lived through both and would readily identify the difference between them.
The question is what to do with that recognition. Our view, grounded in decades of empirical evidence, is that the answer aligns with what sound investment principles have always suggested: build a portfolio that participates across all environments, and maintain the discipline to stay invested through each of them. The data we present in this article explains why.
The Market Spends Most of Its Time Rewarding Investors
Before describing the framework in detail, it is worth presenting the finding that matters most for long-term investors.
We classified approximately 1,045 weekly observations spanning 20 years into six market environments. The three favourable environments, Reflation, Goldilocks, and Benign Carry, collectively account for approximately 72% of all weekly observations over the full sample. Even during the more turbulent period from 2020 to 2026, which included a pandemic, the most aggressive monetary tightening cycle in four decades, and multiple geopolitical disruptions, the share of favourable environments remained above two-thirds.
This is a substantial proportion of time. An investor who steps out of equities to avoid the approximately 28% of the time spent in adverse environments must also forego the 72% spent in favourable ones, and must time both the exit and the re-entry correctly. As we will show, that timing is far harder than it appears.
Exhibit 1: Annualised returns by regime for MSCI World and MSCI EM (2006–2026)
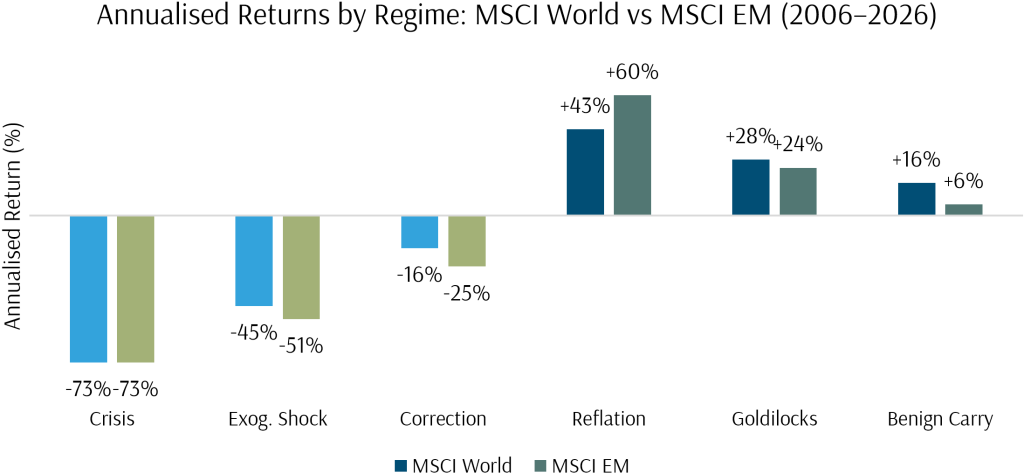
The return dispersion across environments is wide. In Crisis, global equities returns are well-negative; in Reflation and Goldilocks, the converse is true. Emerging markets show an even wider spread, reflecting their higher sensitivity to global risk appetite and growth conditions.
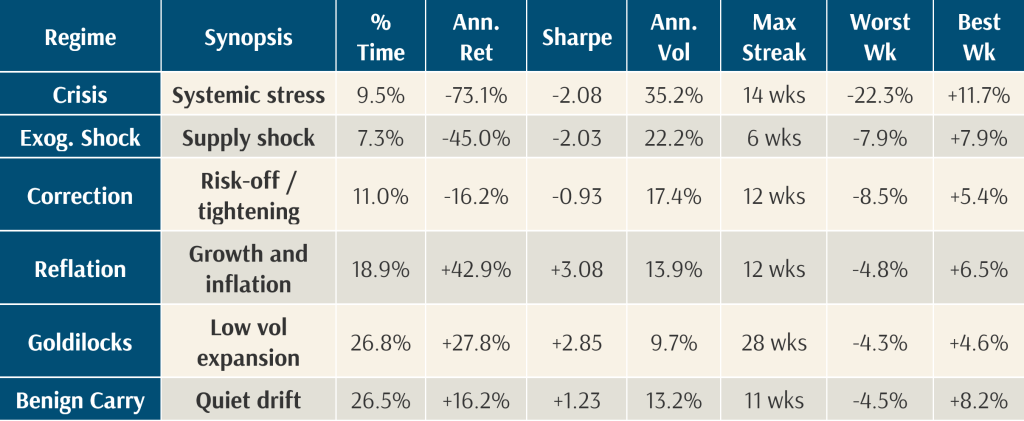
Exhibit 2: Detailed regime return statistics for MSCI World, including Sharpe ratio, volatility, and longest streak.
Understanding the Market’s Moods
To move beyond qualitative descriptions of “good markets” and “bad markets,” we built a classification framework that scores each weekly observation across four macro dimensions:
- Risk appetite (are investors fearful or greedy?)
- Growth (is the economy expanding or contracting?)
- Inflation (are prices stable, rising, or falling?)
- Monetary conditions (is the policy tight or loose?)
Each dimension draws on publicly observable financial indicators such as the VIX Volatility Index, the US yield curve, commodity prices, and the US Dollar Index, and the four scores are combined into a composite that determines the market environment. While it may seem counterintuitive not to include actual economic indicators like payrolls or GDP data, the timing and frequency constraints of these datasets render them rather futile for a model of such a specification.
Crisis is the worst-case scenario. Fear is extreme, credit markets are seizing up, and multiple confirming signals of systemic stress are present. Examples include March 2020, the 2008 GFC, or the European debt crisis. These periods are rare (under 10% of the time) but produce the largest losses.
Exogenous Shock captures supply-driven disruptions: a commodity price spike hitting an already nervous market. Volatility is elevated, but the underlying economy has not collapsed. Examples include early weeks of the Ukraine conflict in 2022, or the Gulf War of 1990.
Correction is the broad category of risk-off conditions short of outright crisis. It includes monetary tightening cycles (much of 2022), periods of weak growth with elevated volatility, and stagflationary episodes where inflation is rising while growth stalls.
Reflation is the pro-cyclical sweet spot: growth is positive, inflation is running above target, and policy is accommodative. Commodities, value stocks, and emerging markets tend to do well. Recall the recovery periods in 2009 to 2010 or 2021. As we discuss in detail below, this has become the dominant favourable environment in recent years, and it comes with a specific set of risks.
Goldilocks is the most benign environment for risk assets. Volatility is low, growth is solid, and there are no extremes anywhere. Examples include 2017, or much of late 2024. Equities grind higher with minimal drawdowns.
Benign Carry is the quiet default: no strong signals in any direction. Markets drift modestly higher, volatility is moderate, and the environment rewards patience more than conviction. Markets spend a large portion of their time here.
Exhibit 3: Market regime classification overlaid on MSCI World and MSCI EM indexed returns (March 2006 to March 2026). Colour bands correspond to the six environments.
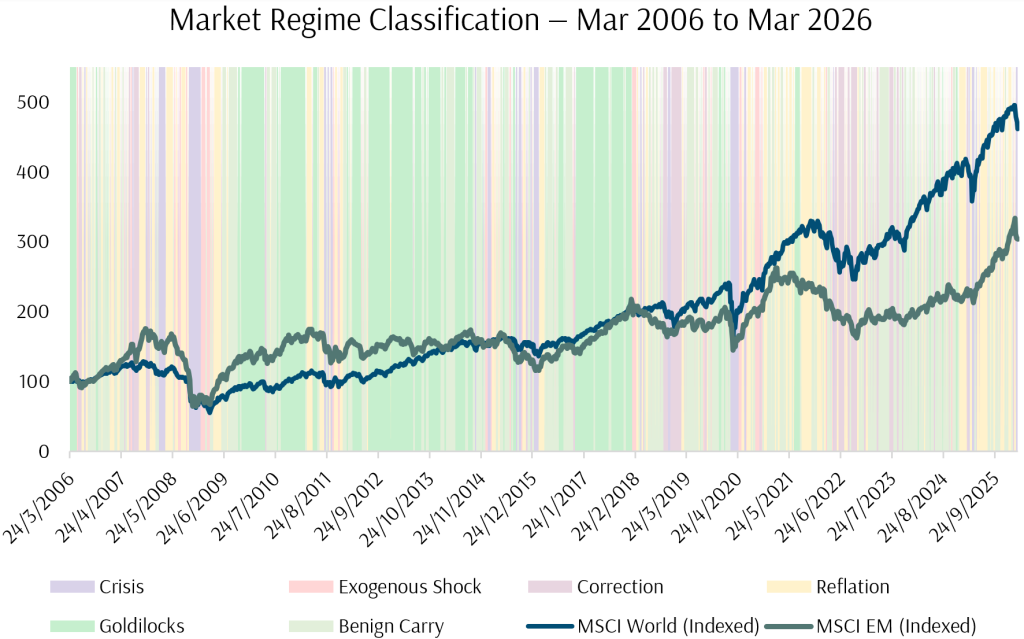
Exhibit 3 overlays these classifications on the full 20 years of market history. The framework captures recognisable periods: the sustained Correction through much of 2022, the shift into Reflation and Benign Carry through 2023 to 2024, the Goldilocks dominance of the mid-2010s, the GFC crisis of 2008-09, and the recent deterioration into Crisis territory in early 2026. The framework tags and quantifies each regime, and places them in a historical context.
How the Market’s Character Has Changed: A 20-Year View
One of the more revealing findings from the data is how the composition of market environments has shifted across different eras. The market of 2011 to 2015 was a fundamentally different animal from the market of 2021 to 2026, and the regime framework makes this visible in a way that headline index returns may not.
Exhibit 4: Regime composition by era (% of time in each environment)
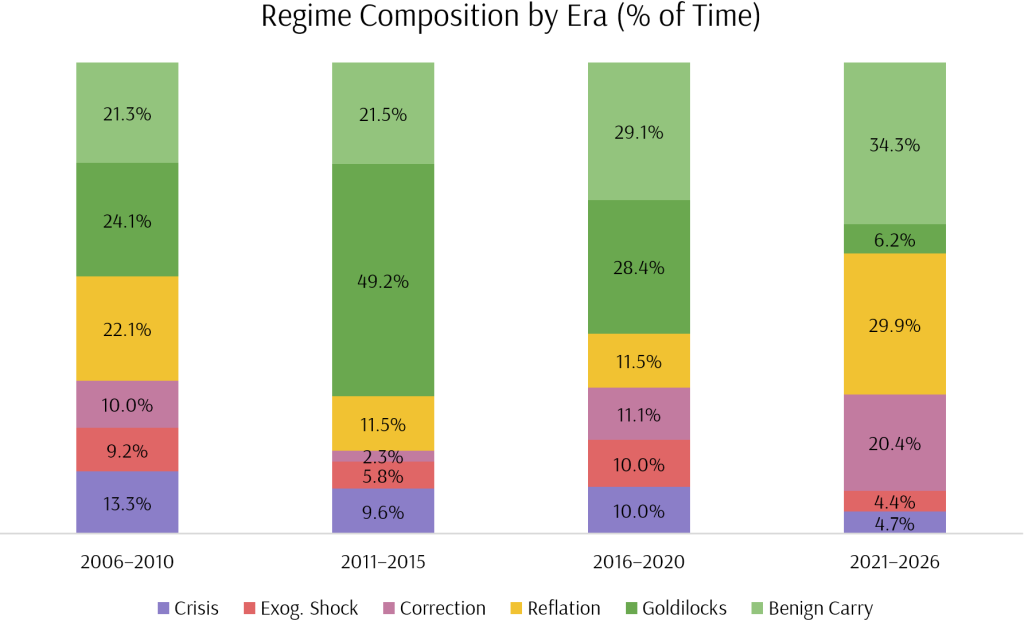
In the post-GFC recovery years of 2011 to 2015, Goldilocks dominated the landscape, accounting for nearly half (49%) of all weekly observations. This was the era of coordinated central bank easing, ultra-low volatility, reasonably low valuations, and extended periods of calm. MSCI World delivered a 20% annualised return in Goldilocks during this period, with just 10% volatility and a Sharpe ratio above 2.0. The longest uninterrupted Goldilocks spell lasted 28 weeks. Markets were well-behaved for long stretches, and drawdowns were shallow and short-lived.
That world is now a rather distant memory. In the period from 2021 to 2026, Goldilocks has collapsed to just 6% of observations. The longest spell is 6 weeks, down from 28. Week-to-week persistence, or the probability that Goldilocks continues from one week to the next, has dropped from 91% in the post-GFC era to 50% in the current one. When the model does classify conditions as Goldilocks today, there is essentially a coin-flip chance that it exits the following week.
What has replaced Goldilocks? Reflation (30% of observations since 2021) and Benign Carry (34%). Together with the diminished Goldilocks, the share of favourable environments still totals roughly two-thirds, preserving the case for staying invested. But the character of those favourable environments has changed in an important way.
The Reflation Era: Running Hot
Reflation has become the dominant growth environment of the post-COVID period, and it is worth understanding what that means for investors.
Over the full 20-year sample, Reflation produces the highest annualised return of any environment at +46%, with a Sharpe ratio of 3.3. These are outstanding numbers. Yet, Reflation also carries meaningfully higher volatility than Goldilocks (14% versus 10%), and its transition profile is considerably less benign. Reflation persists only 59% of the time from week to week, and when it breaks, approximately 19% of exits lead into negative-return environments: 10% into Correction, 6% into Crisis, and 3% into Exogenous Shock. By comparison, Goldilocks exits overwhelmingly into the mild environment of Benign Carry, with almost no direct path to Crisis.
Reflation, in other words, is the high-beta child among the positive regimes in our framework. It delivers strong returns while it lasts, but it is one commodity spike, one policy tightening, or one geopolitical escalation away from tipping into Correction or worse. It is the market running hot, which carries consequences at times.
The post-COVID experience illustrates this vividly. The powerful fiscal and monetary stimulus of 2020 to 2021 produced a classic Reflation environment: surging commodity prices, rising breakeven inflation, a steep yield curve, and exceptional equity returns. The model classified much of 2021 as Reflation. But Reflation also created the conditions for what followed. Rising inflation forced the most aggressive Fed tightening cycle since the early 1980s, which drove the sustained Correction of 2022. The 2022 drawdown was the natural successor to a Reflation that had run its course and tipped into the policy tightening that overheating invites.
The same pattern is visible in 2023 and 2024, where markets oscillated between Reflation (when growth data was encouraging and rate-cut expectations were building), Correction (when inflation proved stickier than expected and rate expectations were repriced), and Benign Carry (when conditions settled into a modest positive drift). The sharp deterioration into Crisis in early 2026, driven by geopolitical escalation and a commodity supply shock, represents another exit from a Reflation that was, by definition, already operating in conditions where a single adverse catalyst could tip the balance.
This is the world investors are navigating today: one where the favourable periods tend to be Reflation rather than Goldilocks, where returns are strong but conditions are less stable, and where the transitions between growth and stress are faster and sharper than in the quiet post-GFC years. The investment implication is the same, but the reasoning is more nuanced. Staying invested remains the correct strategy, because the market still spends the majority of its time in favourable conditions. But investors should expect more frequent turbulence along the way, and should calibrate their expectations for the character of the returns they will experience. This is an environment that rewards broad diversification and steady discipline more than ever.
Observing Markets With a Clear Lens
One of the more underappreciated benefits of a structured framework is what it does to the way we process market stress.
When markets fall sharply, the natural response is to focus on the headlines: the specific policy decision, the geopolitical event, the particular company or sector in the news. This is entirely human. It also means that each downturn feels unique, unprecedented, and therefore uniquely threatening. The 2022 correction felt like it was “about” inflation and the Fed. The 2020 crash felt like it was “about” COVID. The current episode feels like it is driven by its own particular circumstances.
A regime framework offers a different and transformative lens. It allows us to observe that the same underlying macro patterns, such as elevated volatility combined with growth weakness, or commodity supply disruptions combined with policy uncertainty, have occurred repeatedly across different decades, driven by entirely different headlines and personalities. The specific catalyst changes every time. The market’s behaviour in response to those macro combinations is remarkably consistent.
This is valuable because it moves the conversation from “what do we think about this particular event?” and “why is this particular person acting in this way”, and “Is it different this time? Is this the big one”, to “what does the evidence tell us about environments like this one?”
The first question invites speculation and emotional reaction. The second invites evidence-based assessment. When we can say “the current environment shares the macro characteristics of an overheated Reflation that has transitioned into stress, and historically, these episodes have been temporary,” that is a more useful foundation for decision-making than an opinion about whether a particular set of negotiations will produce a favourable outcome.
For investors, this distinction is critical. Behavioural finance research consistently shows that the impulse to sell is strongest when investors feel disoriented, when conditions feel unprecedented and unmoored from any familiar pattern. A named, quantified environment with known historical characteristics is far easier to endure than an unnamed one.
Why Timing Remains Elusive
The framework tells us where we are. The natural follow-up: can it tell us where we are going?
Exhibit 5: Week-to-week regime transition probabilities. Diagonal entries (outlined) show persistence rates.
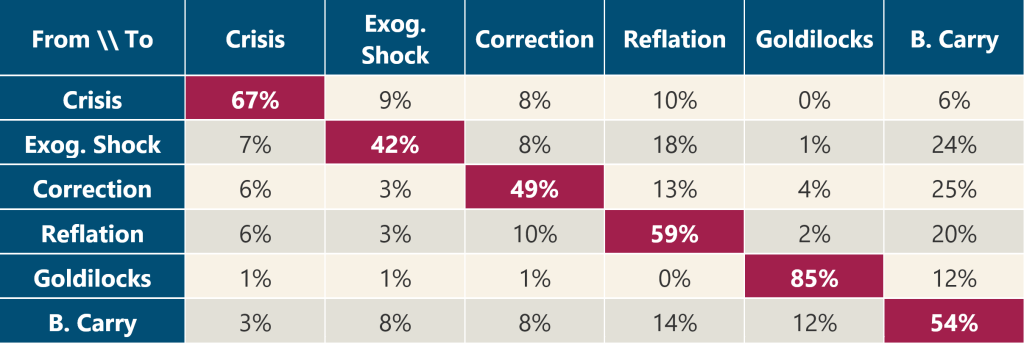
Some environments do persist from week to week at reasonable rates. Crisis persists 67% of the time, Goldilocks at 85%, and Reflation 59%. But the problem lies in what happens when an environment breaks. When Crisis ends, the exits scatter in multiple directions: 10% to Reflation, 9% to Exogenous Shock, 8% to Correction, 6% to Benign Carry. While some regimes are more persistent than others, such persistence is also time-varying in nature. As an example, Goldilocks appears to be a highly persistent regime, yet we can see from Exhibit 4 that the time-share of Goldilocks has fallen in the most recent era, and deeper study also shows that its persistence has also declined.
Thus, an investor who correctly identifies the current environment may still find it a challenge to use the information to predict with useful confidence as to what the next phase will be.
Back-Testing: What Happens When You Try to Time It
The transition probabilities hint at theoretical difficulty in timing tactical moves based on market regimes. We also tested what happens when you try it in practice.
We ran a simple back-test. A linear allocation rule scales equity exposure based on the current environment: 100% in Goldilocks, 80% in Reflation, 60% in Benign Carry, 40% in Correction, 20% in Exogenous Shock, and 0% in Crisis. The balance is held in cash. We ran this strategy under two scenarios. In the first, the portfolio knows this week’s environment and positions accordingly, a scenario that requires perfect foresight. In the second, the portfolio executes the following week based on last week’s observed environment, which is what any real-world implementation would require.
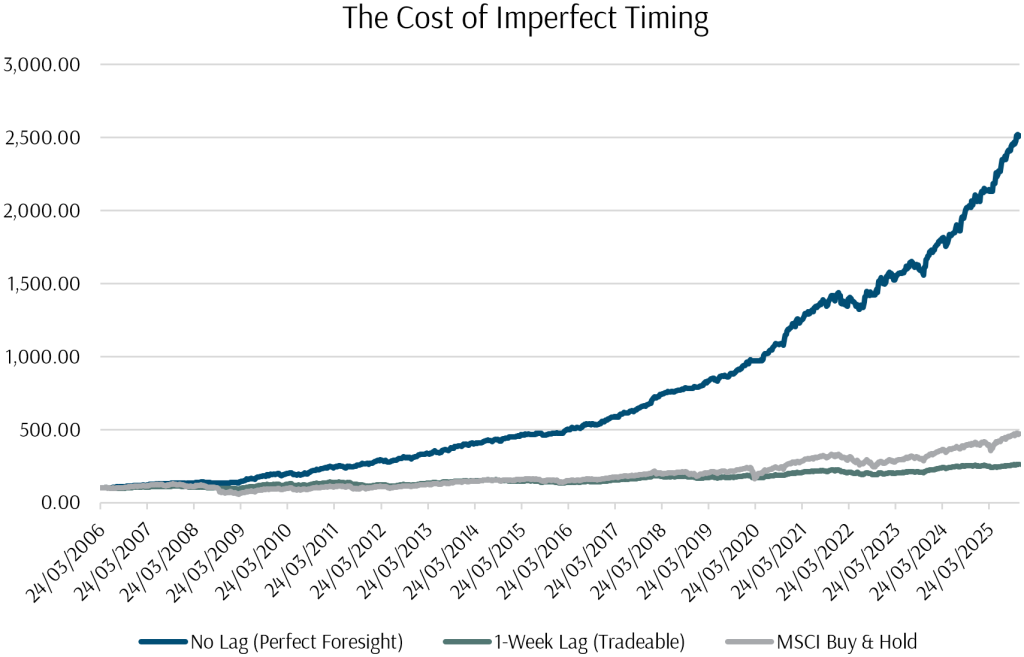
Exhibit 6: The cost of imperfect timing. Log-scale NAV of three strategies (March 2006 to March 2026).
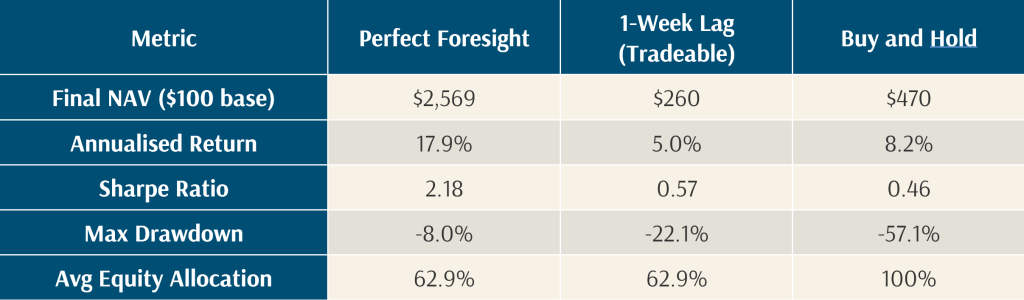
The results are instructive. With perfect foresight, the strategy is extraordinary: $100 grows to $2,569 at a 17.9% annualised return with a maximum drawdown of just 8%. With a single week of execution delay, the same strategy, using the same model and the same allocation rules, returns just 5.0% annualised, falling short of buy-and-hold on absolute return, despite running at only 63% average equity exposure. In other words, the model correctly identifies the environments. But by the time you can act on the information, the opportunity has passed.
There is one important nuance. The lagged strategy does deliver genuine risk reduction: volatility is roughly halved and maximum drawdown is -22% versus -57% for buy-and-hold. While the framework provides useful information about risk, it fails as a return-generation tool, and the resulting shortfall in performance is significant enough to determine the difference between a successful planning outcome and an unsuccessful one.
This is a clear demonstration of why the regime framework is valuable for understanding risk and maintaining discipline, but unsuitable for tactical trading. If a model built on 41 indicators and 20 years of data cannot produce tradeable timing signals with a one-week delay, it is difficult to argue that a simpler approach, whether based on market commentary, gut feeling, or a handful of indicators, would fare better. It also highlights the perils of making major portfolio decisions based on the prognostications of the macro-commentators who often appear so brilliant and knowledgeable on media channels.
What This Means for Portfolio Construction
If regime transitions are unpredictable and even well-constructed timing strategies fail in practice, the logical response is to build portfolios that perform adequately across all environments rather than concentrating into a bet on any single outcome.
Exhibit 7: Annualised returns by asset class and regime (2006–2026). Green = positive; red = negative
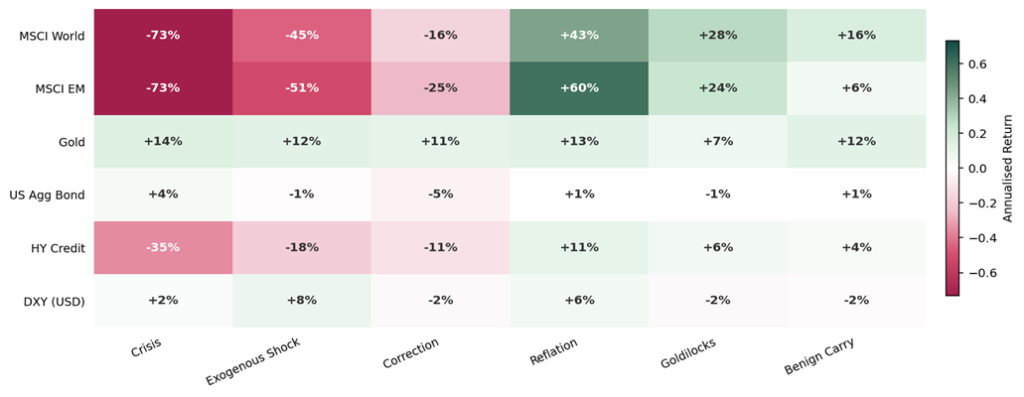
Global equities deliver strongly positive returns in Reflation, Goldilocks, and Benign Carry, but suffer in Crisis and Exogenous Shock.
Gold is positive across all six environments, including double-digit annualised returns during Crisis (+14%), Exogenous Shock (+12%), Correction (+11%), Reflation (+13%), and Benign Carry (+12%). This lends empirical evidence validated across multiple economic cycles to support a long-term strategic allocation to Gold. While total returns generated through the investment lifetime may fall short of equities, a positive through-the-cycle return profile significantly improves risk-adjusted returns for portfolios, without incurring an excessive opportunity cost.
Investment-grade bonds provide a modest positive return during Crisis (+4%), validating their flight-to-quality role, but delivered negative returns during the 2022 rate-hiking cycle Correction. In general, Bonds protect against growth shocks but suffer during inflation-driven tightening.
Each asset class in a diversified portfolio has environments where it earns its place. If a portfolio stripped out bonds because they dragged in 2022, the crisis hedge would be missing. Omitting gold because it seemed redundant during calm periods would also remove the shock absorber in times of volatility and geopolitical stress. Being entirely concentrated into equities because the recent environment has been favourable, may mean higher-than-expected volatility and more portfolio turbulence in the future.
Conclusion
Market environments are identifiable, statistically distinct, and persistent across 20 years of data. The framework provides a coherent explanatory model for the full arc of market history from 2006 to the present: the GFC crisis and its aftermath, the extended Goldilocks era of the mid-2010s, the Reflation-driven recovery from COVID, the tightening-driven correction of 2022, and the geopolitically-triggered deterioration of early 2026. They are transitions between recognisable macro environments, each with well-documented return characteristics and each following patterns that have repeated, with different catalysts, across multiple cycles.
The character of those environments has evolved in a way that matters for forward-looking expectations. The quiet Goldilocks conditions that dominated 2011-2017 have given way to a Reflation-led landscape where returns are strong but conditions are less stable, and transitions between growth and stress are faster and sharper. Investors calibrated to the post-GFC experience should expect to earn their returns in a bumpier fashion.
For investors and their advisers, the framework provides three practical advantages. First, it allows us to evaluate every component of a diversified portfolio against its regime-level track record. When we observe that gold has delivered positive returns across all six environments over 20 years, or that investment-grade bonds fulfilled their flight-to-quality role in every growth-shock regime, these are empirical observations that provide durable conviction for allocation decisions, particularly during periods when individual asset classes are under pressure. Next, the framework provides a structured vocabulary for diagnosing market stress in real time. Identifying conditions as a “Correction driven by monetary tightening” rather than an undefined crisis transforms the conversation from speculation to evidence-based assessment. Last of all, the regime data support the case for staying invested: the 72% positive-environment share validates long-term equity participation, while the transition analysis explains why attempting to avoid the remaining 28% through timing creates more risk than it eliminates, and may mean the difference between investment success and failure.
The evidence for tactical timing based on regime signals may be underwhelming, but the evidence for regime-informed portfolio design and investment discipline is substantial. Understanding the market’s patterns is a necessary step towards constructing a portfolio resilient enough to participate through all of them and building the evidence-based conviction to hold that portfolio when the headlines are most unsettling.
Methodology Note: How We Classify Market Environments
The following describes the analytical framework used to classify market environments for the research presented in this article. The classification framework is a rules-based, multi-dimensional scoring system that classifies each weekly observation into one of six market environments using approximately 1,045 weekly observations spanning 20 years, sourced from LSEG Refinitiv.
Indicator selection
We investigated 41 macro indicators and proxies across six asset classes (FX, rates, commodities, credit, equity, and volatility) for their informational value in distinguishing between market environments. Indicators were evaluated for economic relevance, signal clarity, and whether they added discriminatory power beyond what existing inputs already captured. The final model draws on a focused subset of highly informative indicators, while the broader set remains available for future model enhancements and is used also used in providing confirmation signals.
Dimensional scoring
Each weekly observation is scored across four macro dimensions, each bounded between -1 and +1:
Risk Appetite is derived from a rolling 2-year z-score of VIX futures levels, confirmed by high-yield credit returns. The z-score normalisation ensures that volatility readings are assessed relative to their own recent history rather than against a fixed threshold, adapting automatically to shifting volatility regimes. A high score indicates elevated fear; a low score, complacency.
Growth / Cycle combines the US Treasury yield curve slope (10-year minus 2-year) with copper futures returns as a proxy for global industrial activity. The yield curve captures market expectations for growth and monetary policy, while copper provides a real-time, market-priced signal of physical demand.
Inflation Regime tracks the 10-year breakeven inflation rate relative to the 2% policy anchor, supplemented by broad commodity index momentum. This dimension captures both market-implied inflation expectations and the real-economy price pressures that drive central bank responses.
Monetary/Liquidity captures the direction of the US Dollar Index and changes in short-term Treasury yields as signals of policy tightening or easing.
Each dimension is normalised using a rolling two-year window to prevent any single extreme from dominating the composite. The four scores are averaged into a single composite.
Confirming signals and hierarchical classification
In addition to the four dimension scores, the model uses a set of binary confirming signals that act as gates for specific regime classifications. These include commodity supply spikes (Brent crude), credit stress (high-yield credit), growth collapse, safe-haven flows (gold), and VIX momentum. The signals ensure that classifications are not driven by a single dimension in isolation.
The composite score and confirming signals feed into a hierarchical set of classification rules applied in strict priority order, with the first rule satisfied determining the label. Adverse environments take precedence over favourable ones: an observation with both elevated inflation and extreme volatility will be classified as Crisis, not Reflation. The framework is designed to err on the side of caution in identifying risk. If no rule is triggered, the observation falls into Benign Carry as the residual classification.
Hysteresis
The model incorporates a self-referential hysteresis mechanism to reduce excessive regime flipping. Entry thresholds for each regime are stricter than continuation thresholds: once an environment is established, it requires less extreme readings to persist into the following week. This reflects the practical reality that macro environments do not switch instantaneously and that borderline readings should not cause classifications to oscillate on a weekly basis.
Model integrity
All inputs are publicly observable macro indicators with no forward-looking information. No parameters have been optimised to fit historical returns.
The writer of this article, Glenn Tan, is Senior Portfolio Manager at Providend Ltd, Southeast Asia’s first fee-only comprehensive wealth advisory firm. He is also a CFA Charterholder and a Certified Financial Risk Manager (FRM).
For more related resources, check out:
1. Active Investing That Adds Value to the Client
2. Why Recent Market Outperformance Does Not Replace the Need for Global Diversification
3. Here’s Why We Charge a Higher Fee Than Robos
Download our Investment eBook titled “A More Reliable Way to Get Enough Investment Returns: Even During Times of Market Uncertainty” here.
With a minefield of financial misinformation out there, we promise to be a safe pair of hands and a second pair of eyes to help you avoid costly financial mistakes. Learn more about our investment philosophy here.
We do not charge a fee at the first consultation meeting. If you would like an honest second opinion on your current estate plan, investment portfolio, financial and/or retirement plan, make an appointment with us today.