


August Market Summary
Global equities recovered in August, regaining the ground lost in July’s selldown in AI shares. The MSCI All Country World IMI rose 2.79% and the S&P 500 rose 2.72%, both to record closes, led by the technology shares that had fallen hardest the month before. The software sector rose 16.28% and technology 6.36%, taking the Nasdaq 100 up 4.24%.
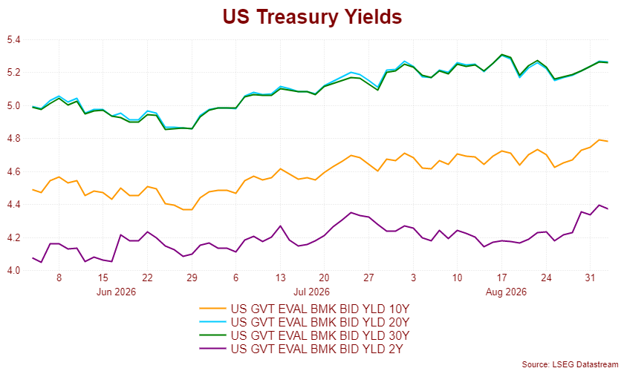
Alongside the recovery in equities, gold rose 10.08%, silver 14.98% and bitcoin 25.38%, an uncommon pairing of a risk-led equity rally with strong demand for gold and other hard assets. Bond markets were mixed, with the US 10-year yield little changed while European and Japanese yields rose.
The rebound in AI shares was led by software and the larger platform companies, while the memory chipmakers at the centre of July’s decline recovered more slowly, with semiconductors up 2.98%. Brokers reported heavy deleveraging across the previously crowded parts of the market in early August, which set a calmer base for the rest of the month. Second-quarter earnings, reported through August, were strong. S&P 500 earnings grew about 31% year-on-year, with AI infrastructure companies accounting for roughly half of that, and the median company grew earnings 14%, evidence that profit growth has broadened beyond the index heavyweights.
The defining event was Chair Warsh’s first Jackson Hole address on 28 August. With inflation running above the 2% target, he said the Committee’s “predominant focus right now should be on prices”, and described the inflation readings as “concerning” even after softer summer prints. Markets read the speech as hawkish. The two-year Treasury yield rose about 7 basis points immediately afterwards, one of the larger moves around a Jackson Hole speech in recent years, and pricing for a September rate rise moved to slightly above 50%. Earlier in the month, a second consecutive set of soft jobs and inflation readings had pushed those odds down, so the address turned rate expectations back towards tightening.
The US Dollar Index fell 0.49%, and the Singapore dollar appreciated 0.89%. The yen fell 1.34%, as part of July’s intervention-driven gains faded under market pressure. Oil was little changed, with Brent up 0.41% as the disruption at the Strait of Hormuz stabilised while staying unresolved. Gold’s strong gains, together with the moves in silver and bitcoin, coincided with the softer dollar and with the US Treasury’s decision on 19 August to at least double its buybacks of long-dated bonds, which drew attention to the fiscal and debt-management backdrop.
International and emerging markets led. The MSCI EM IMI rose 4.08%, with Taiwan’s TAIEX up 7.14% and Korea’s KOSPI recovering 2.49% after July’s decline. Japan’s TOPIX rose 3.85% and Singapore’s STI 3.40% to further record highs. Hong Kong’s Hang Seng fell 0.99% and mainland A shares were close to flat, giving back some of July’s strong outperformance.
Providend’s factor-tilted portfolios recorded solid gains in August, with value-tilted funds outperforming again, though the small cap factor gave back some of July’s relative outperformance as rate-hike expectations rose towards the end of the month. The DFA Global Core Equity Fund returned 2.11% in SGD terms and the DFA EM Large Cap Core Equity Fund 4.70%, while fixed income funds were close to flat as US yields steadied.
This month’s investment questions section covers the US Treasury’s long-end buybacks, the coordinated yen intervention, and what they mean for the dollar. For diversified investors, August rewarded staying invested through July’s volatility, with markets at record highs and earnings growth broadening.
Equity Market Performance
US Equities
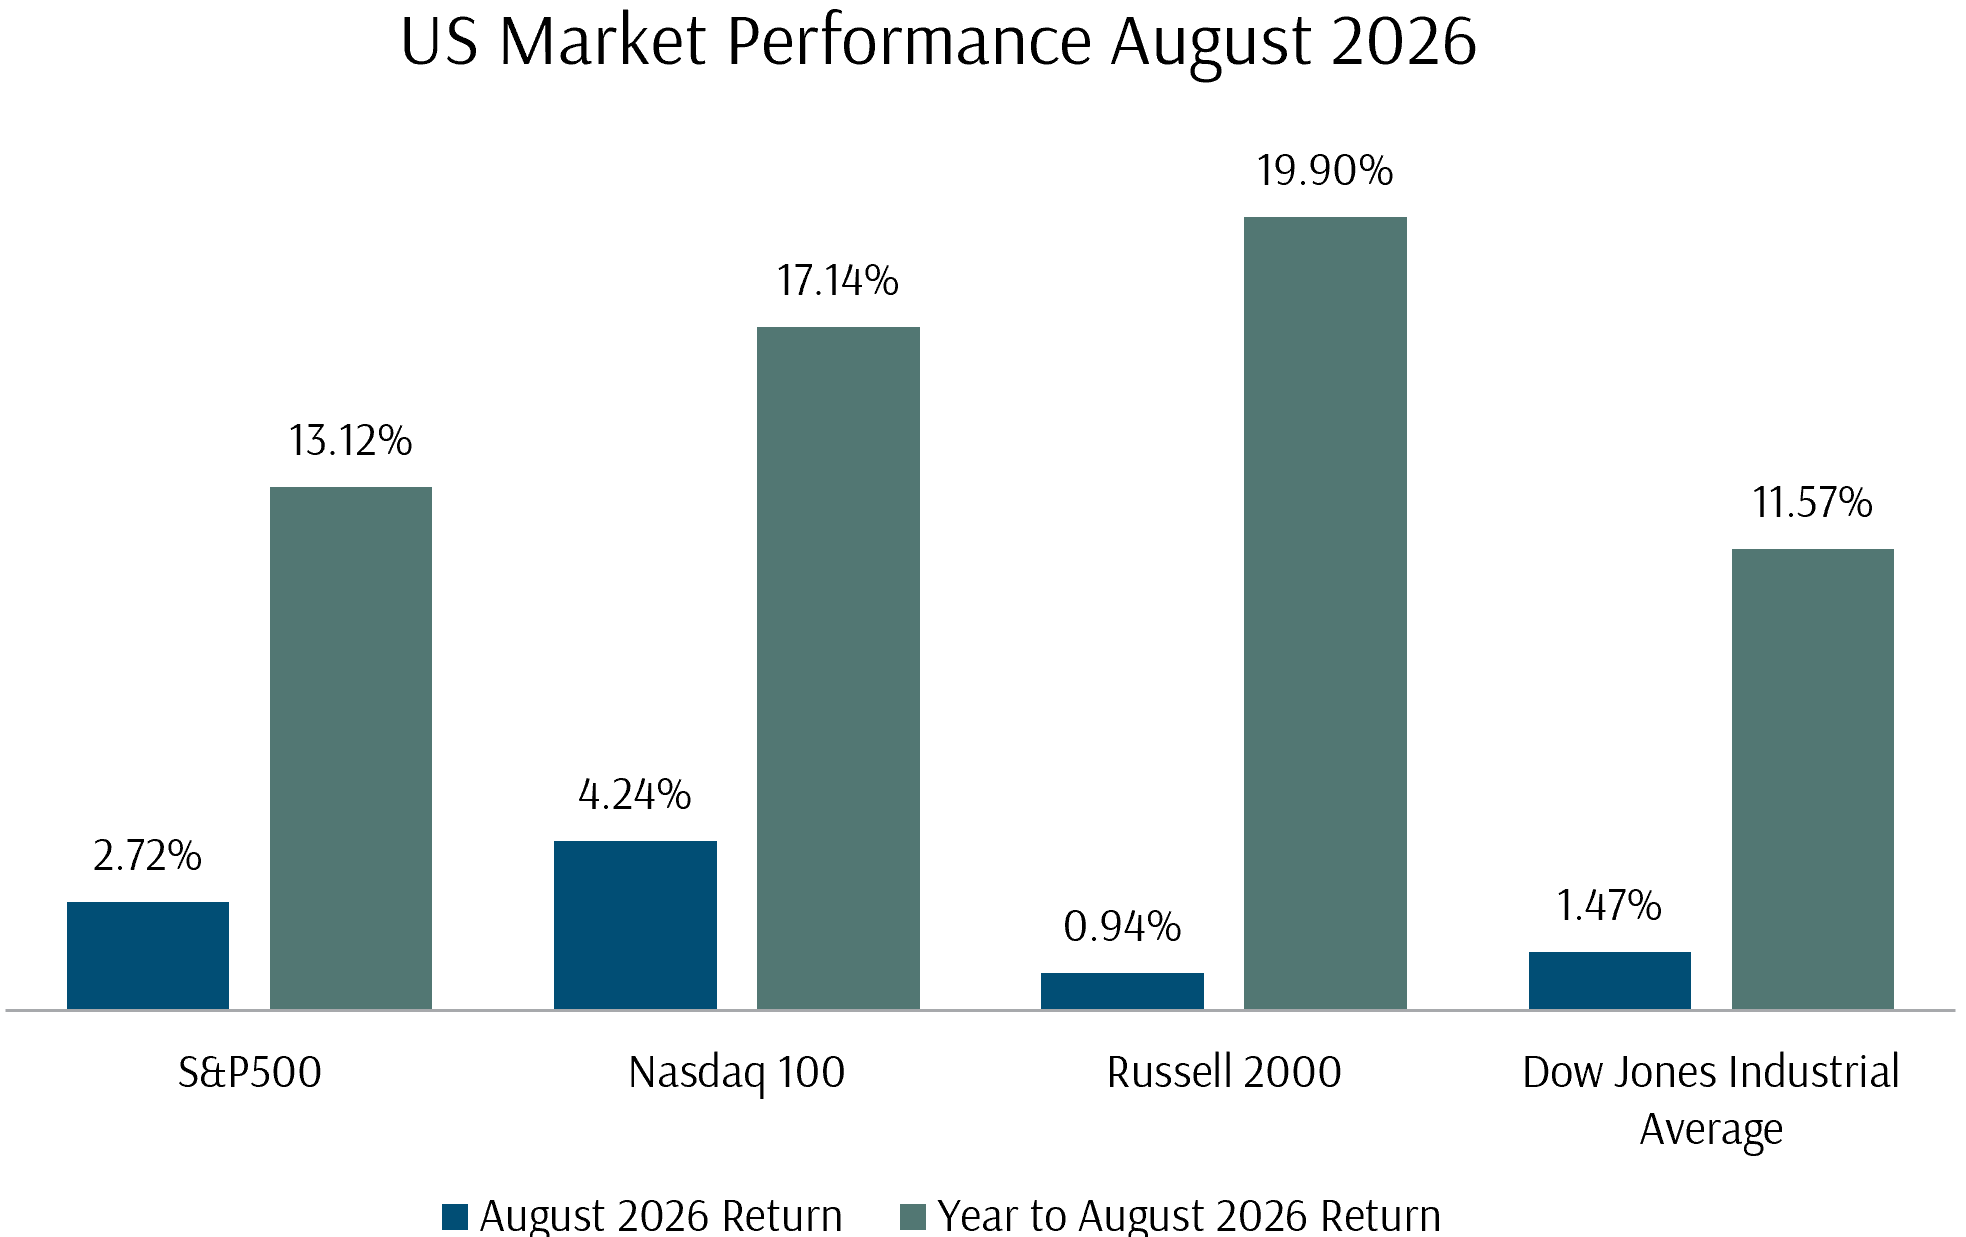
The S&P 500 rose 2.72% in August and the Nasdaq 100 4.24%, closing at record highs as the technology shares that fell in July recovered. The Dow Jones Industrial Average rose 1.47% and the Russell 2000 0.94%.
Leadership reversed from July. Technology rose 6.36% and the Magnificent Seven 4.21%, with the software sector up 16.28% as the “Saas-pocalypse” continued to abate, while semiconductors recovered more modestly at 2.98%. Energy led at 7.41% as the Iran conflict flared for the umpteenth time, while health care rose 4.92% and materials 4.48%.
Economic data generally softened. July headline inflation eased to 3.4% year-on-year from 3.5%, with prices up 0.1% on the month. Nonfarm payrolls fell by 23,000 in July, after a downwardly revised 20,000 gain in June, and retail sales fell 0.6%, though the unemployment rate slipped to 4.1% from 4.2%. Business surveys held up, with the manufacturing PMI at 53.9 and services at 55.4, both in expansion.
The softer jobs and inflation data reduced the probability of further rate rises through the middle of the month. Chair Warsh’s Jackson Hole address on 28 August then set inflation as the priority, and pricing for a September move returned to slightly above even odds. The August inflation reports, due before the 15 to 16 September FOMC, will likely be pivotal in the final outcome of the September meeting.
Exhibit 1: Us Stock Market Performance August 2026 (USD)
International equities
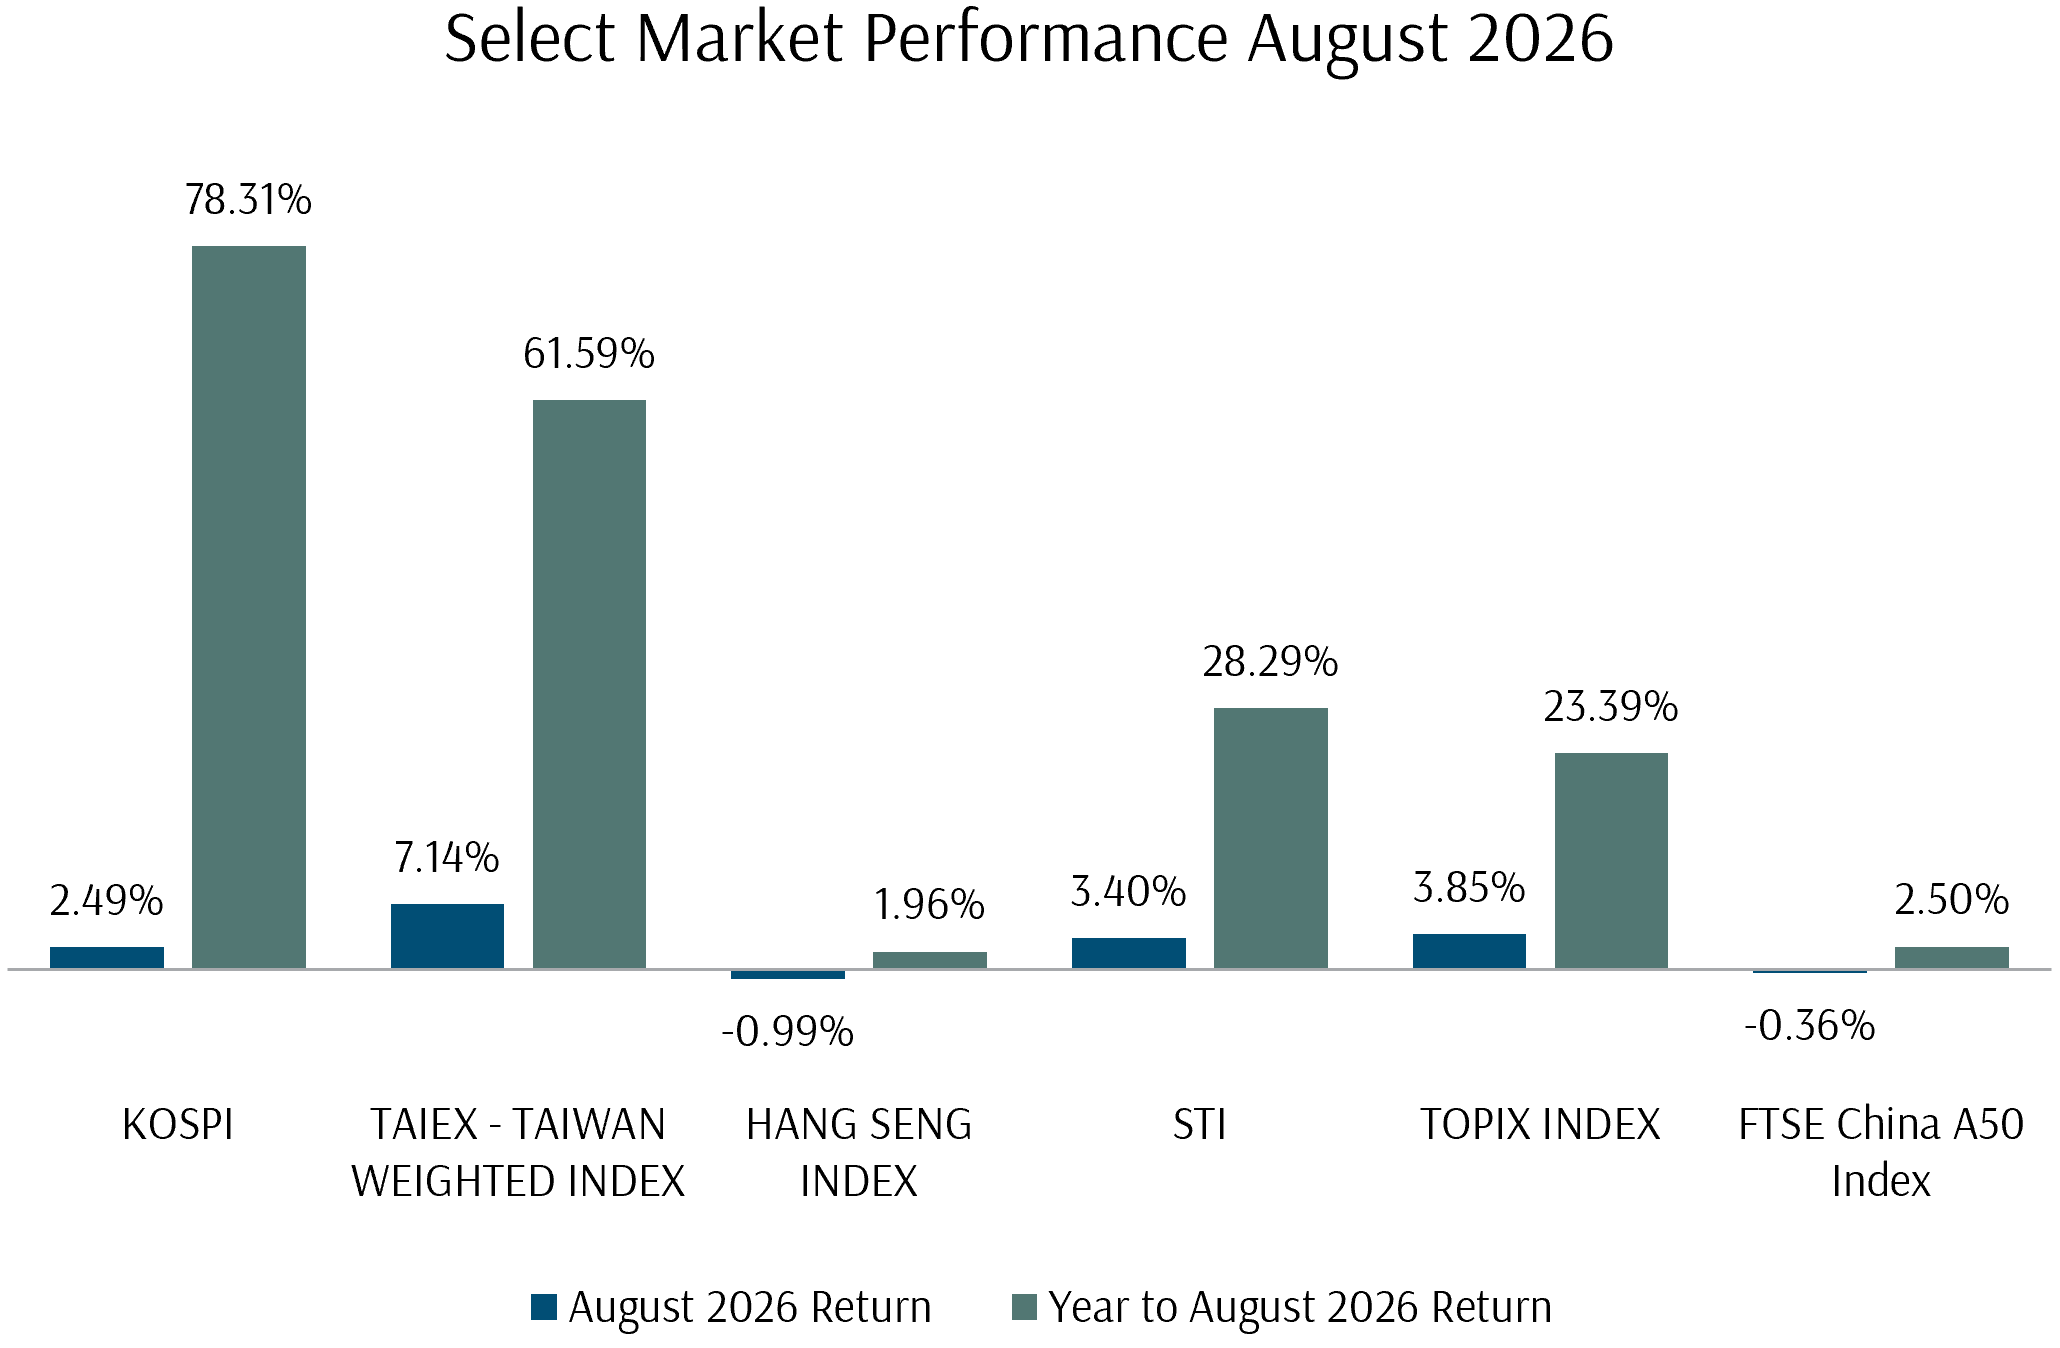
Asian markets led again, this time to the upside. Taiwan’s TAIEX rose 7.14% as the recovery in AI and semiconductor demand resumed, and Japan’s TOPIX rose 3.85%. Korea’s KOSPI rose 2.49%, recovering after July’s record decline, supported by the memory chipmakers’ record quarterly earnings.
Singapore’s STI rose 3.40% to new record highs, with local banks again the main contributor. Greater China lagged the region, with Hong Kong’s Hang Seng down 0.99% and the FTSE China A50 down 0.36%, giving back part of July’s gains as investors rotated back to the technology markets, which had underperformed in the previous month.
Exhibit 2: Select Market Performance August 2026 (Local Currency)
Global summary
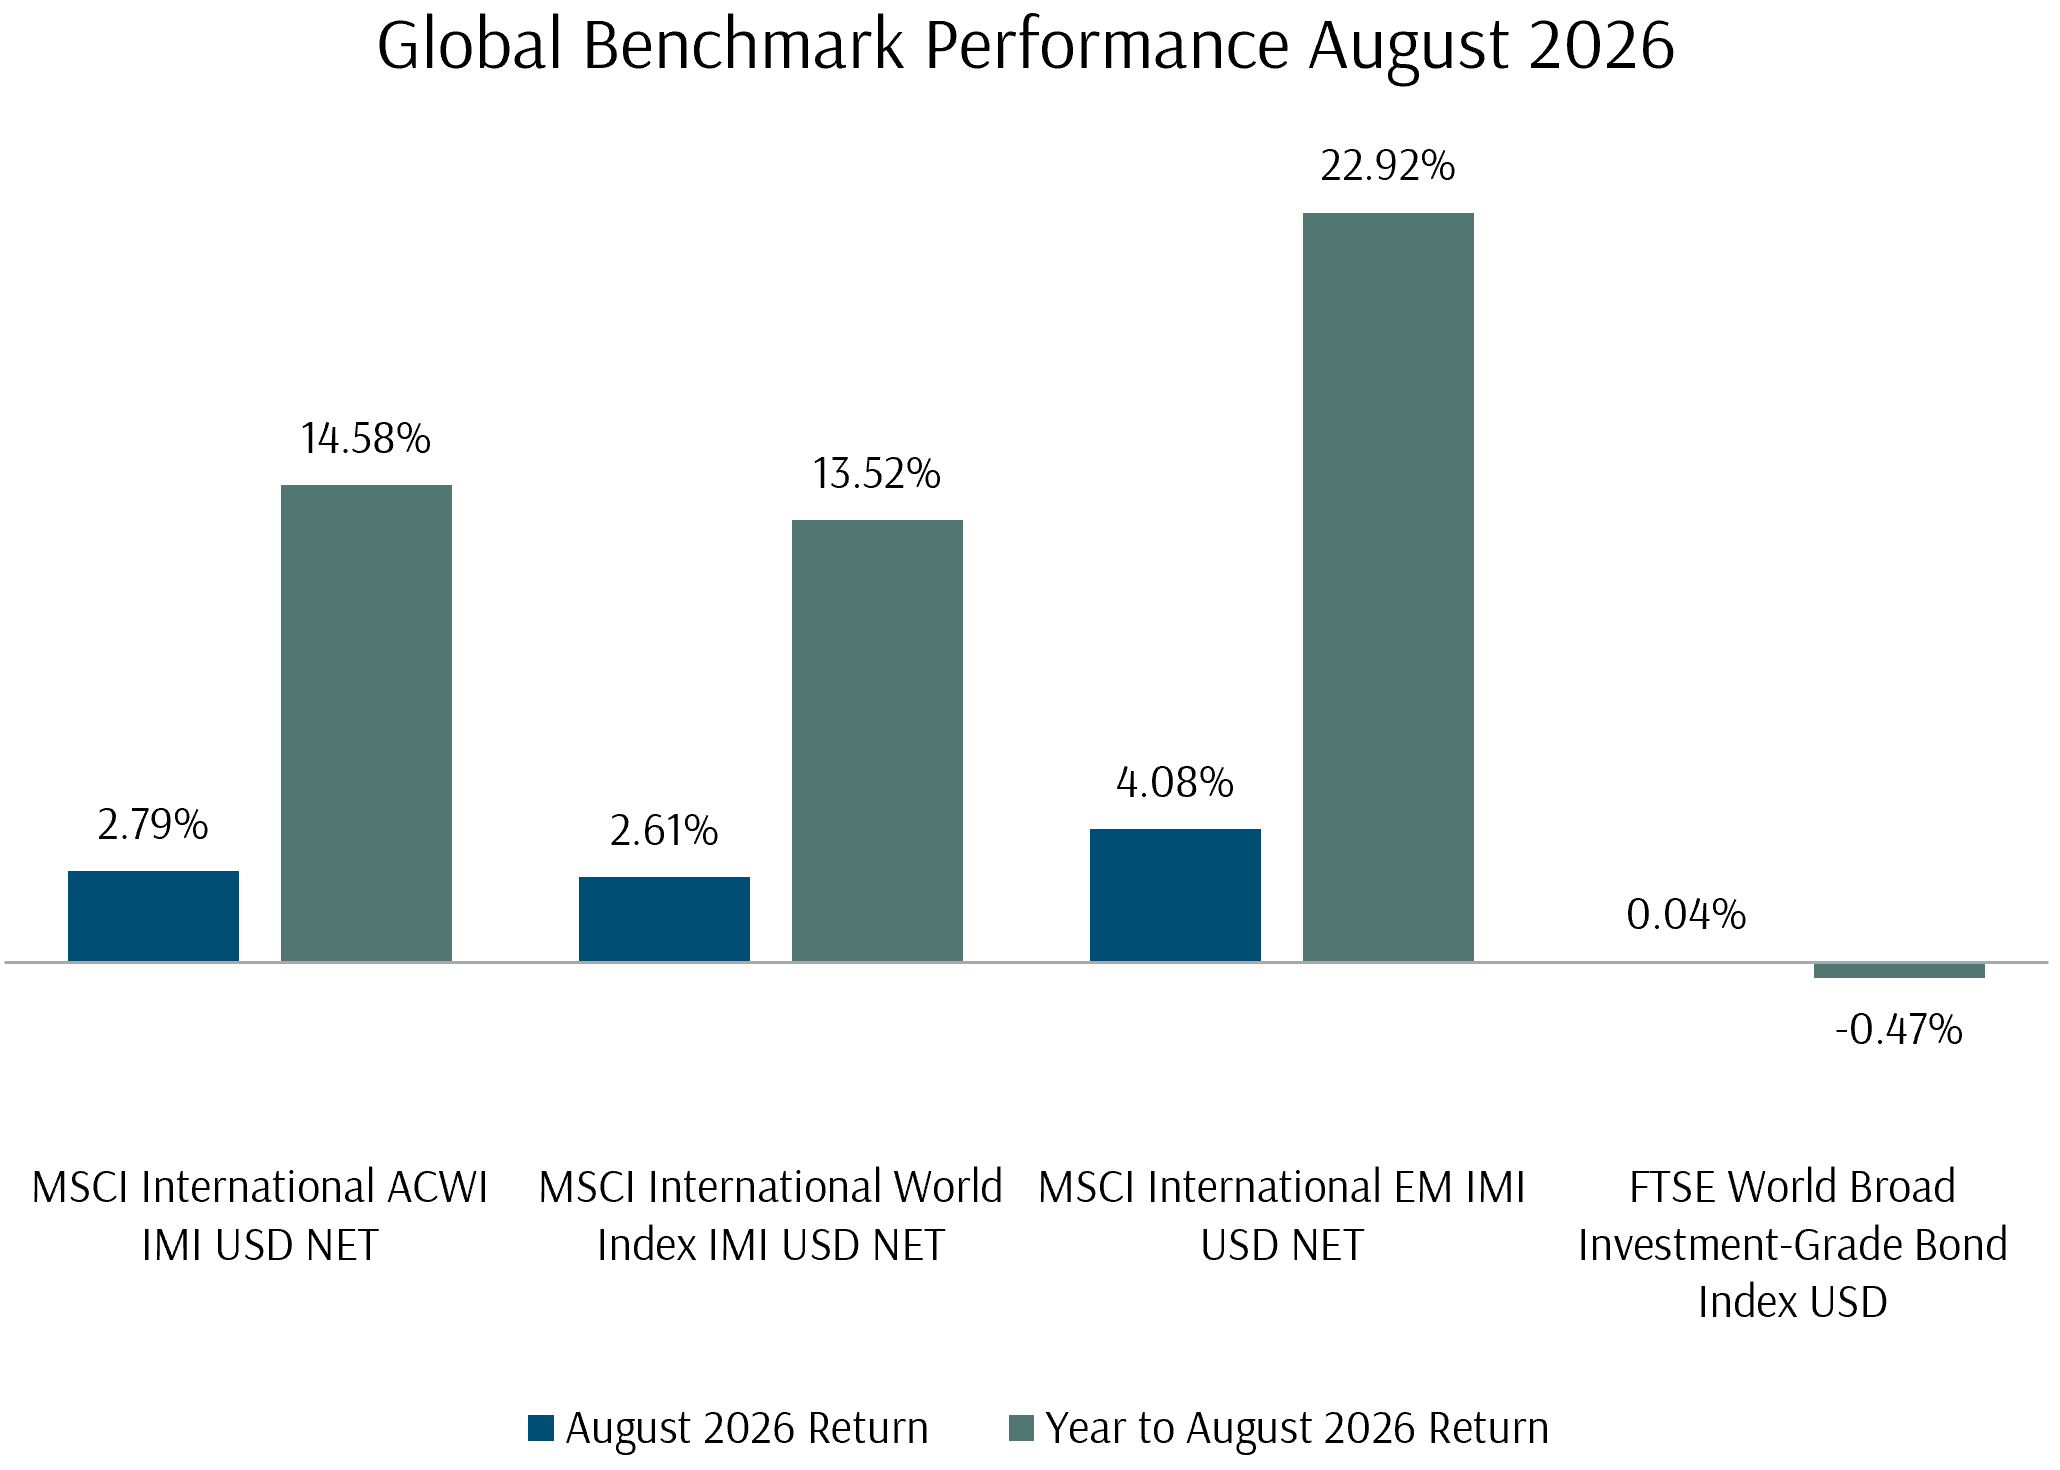
The MSCI All Country World IMI returned 2.79% in August and the MSCI World Index IMI gained 2.61%, while the MSCI EM IMI rose 4.08%, led by Taiwan and Korea. Year-to-date, the MSCI ACWI IMI added to its year-to-date gains, now up 14.58%, and the MSCI EM IMI is up 22.92%.
Exhibit 3: Global Equity Benchmark Index Performance August 2026 (USD)
Cross-Asset Performance
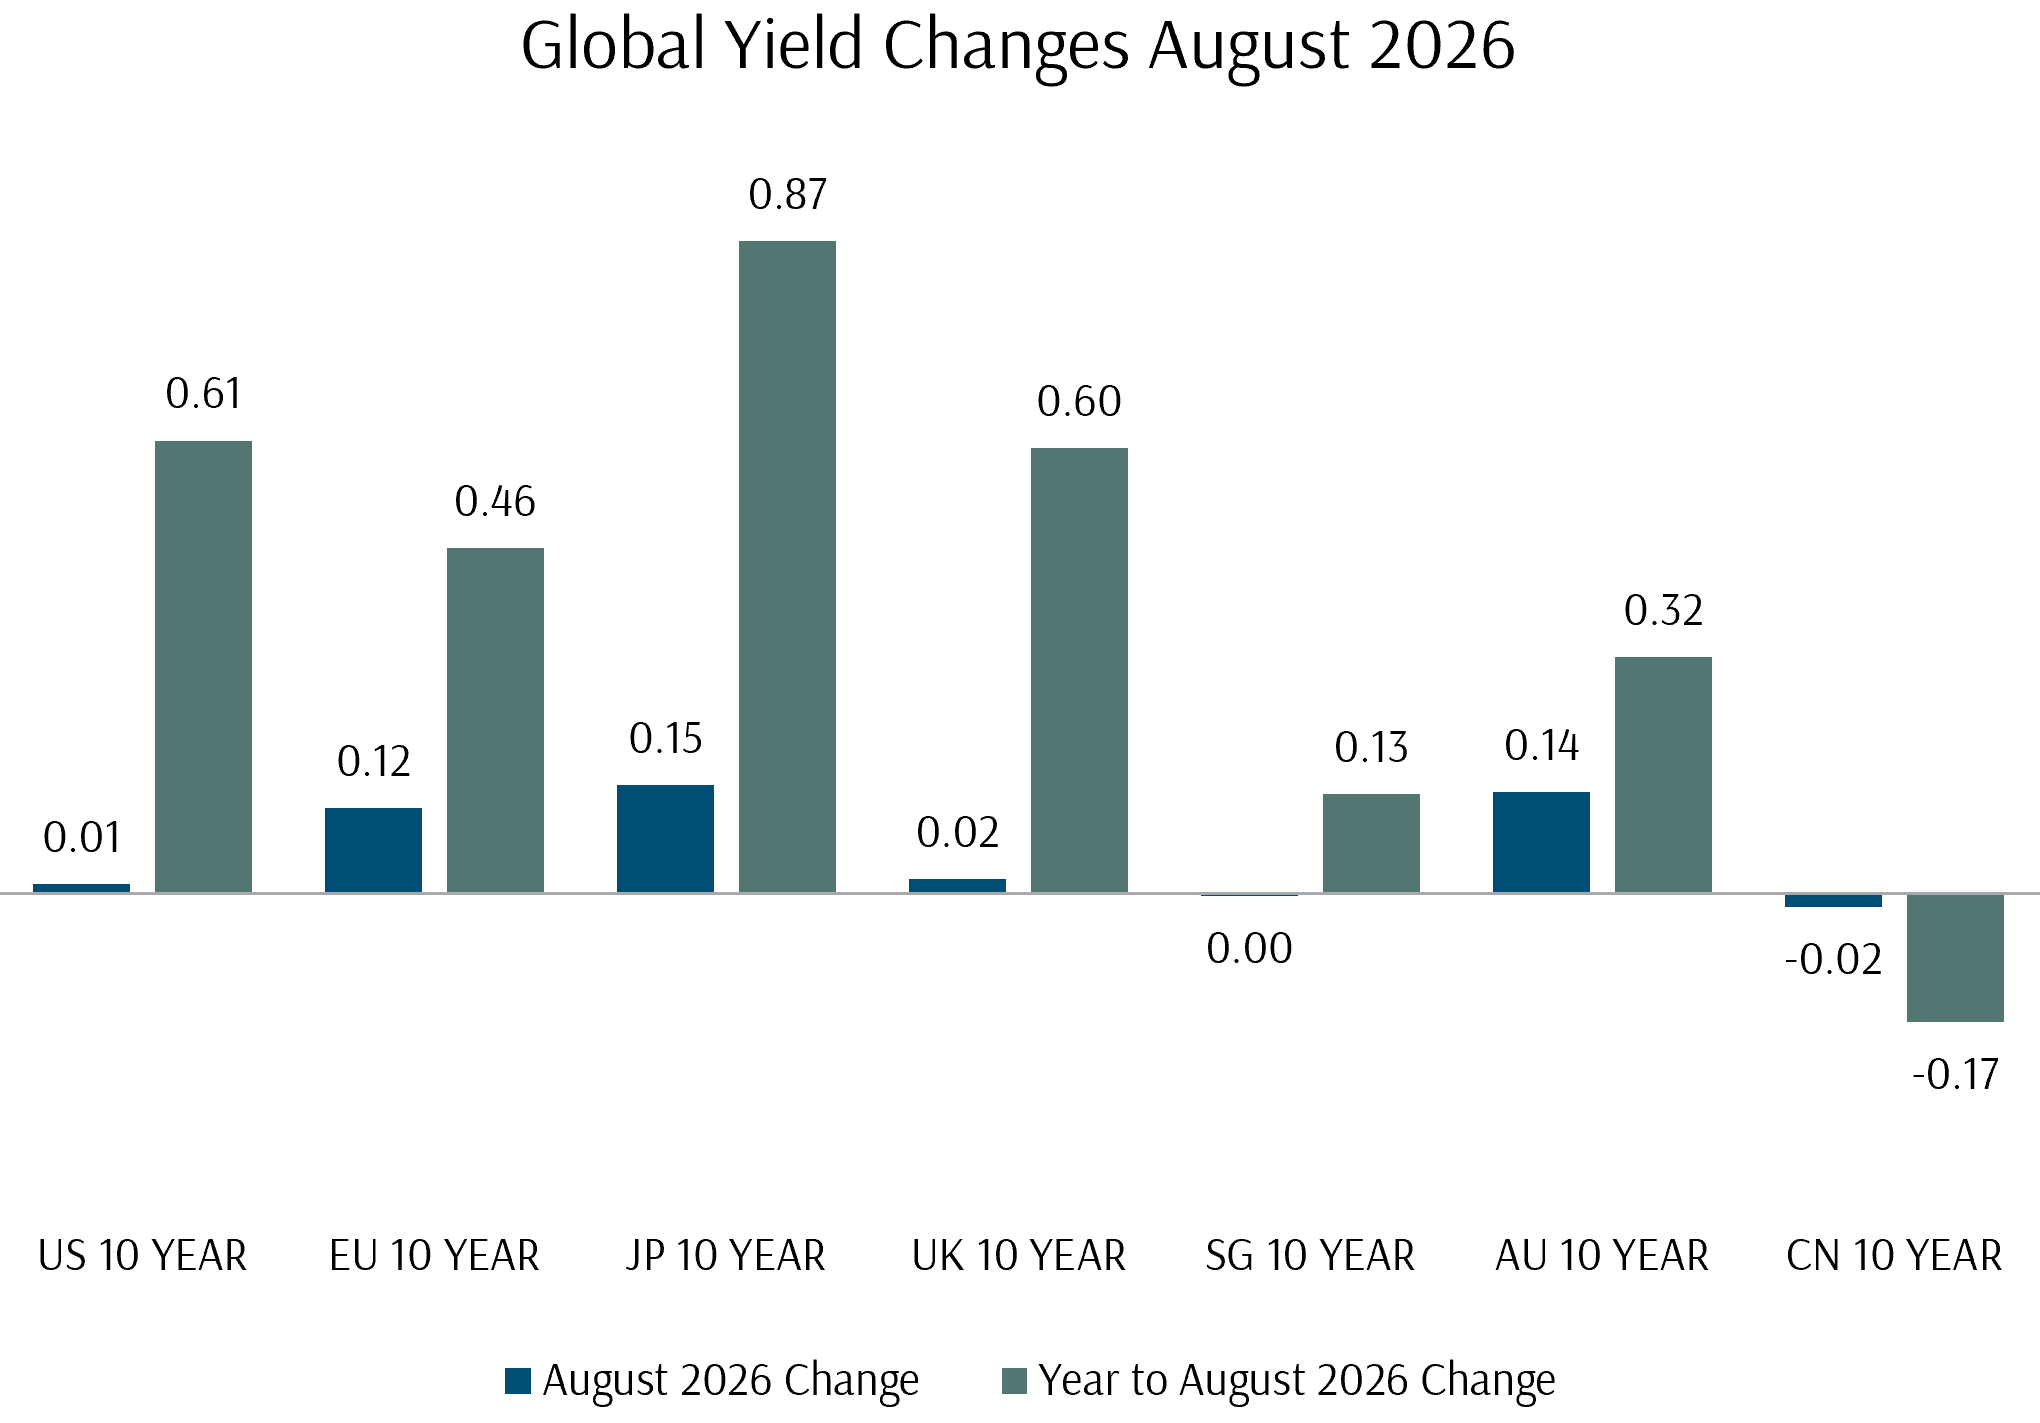
Government bond markets diverged in August. The US 10-year yield was little changed, up 1.3 basis points, as the Treasury’s move to support the long end and softer domestic data offset the hawkish turn in Fed communication. Elsewhere, yields rose. Ten-year yields increased 14.5 basis points in Japan, 13.6 in Australia and 11.5 in Europe, where inflation and policy-tightening pressure persisted, while the UK rose 2.0 and China fell 1.8. The FTSE World Broad Investment-Grade Bond USD Index returned 0.04%.
Exhibit 4: Global Yield Changes August 2026
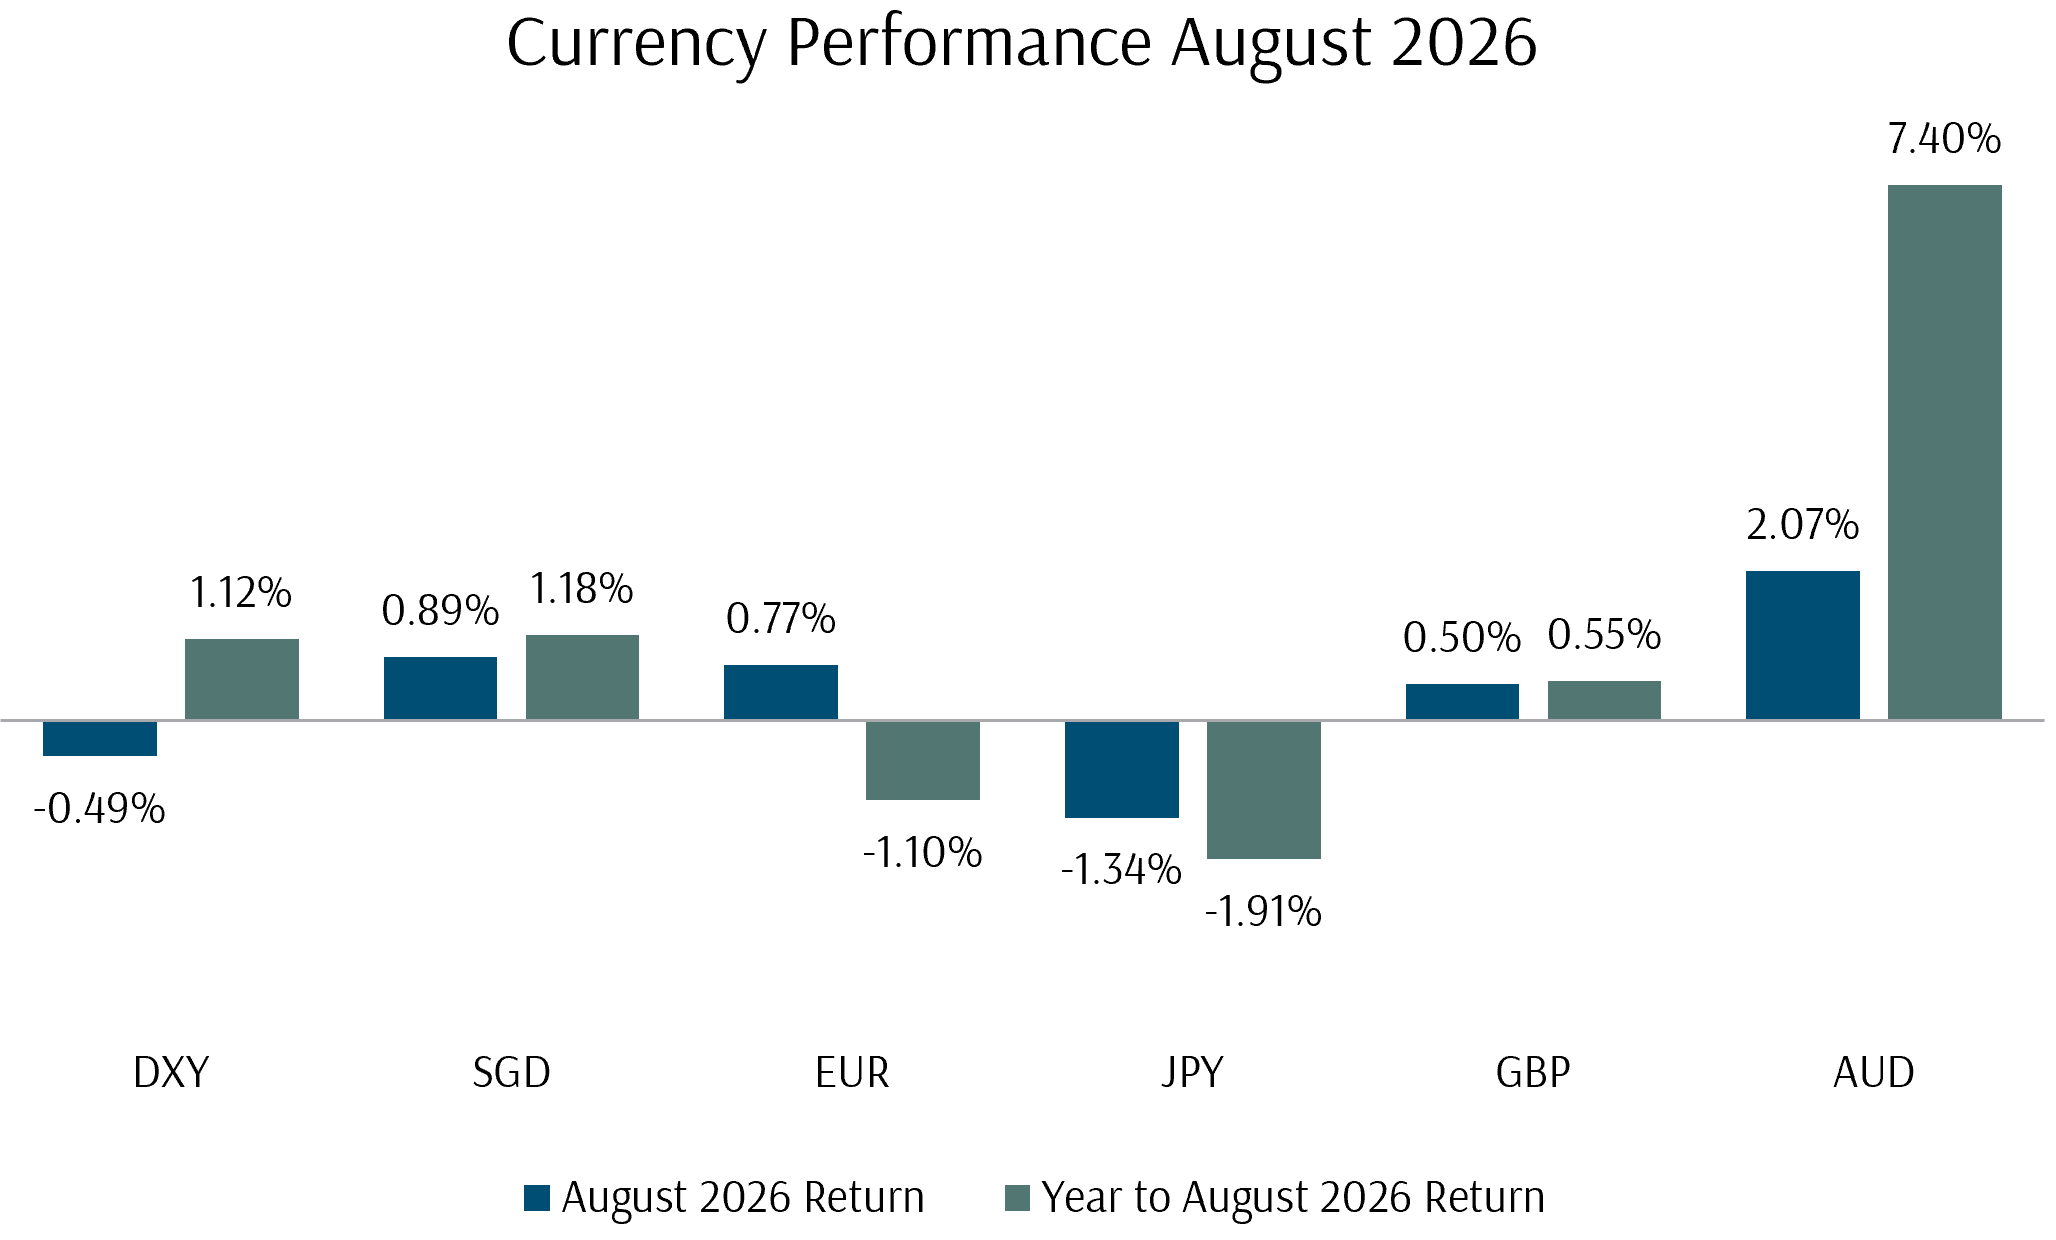
The US Dollar Index fell 0.49% in August. The Australian dollar rose 2.07%, supported by firmer commodity prices, and the Singapore dollar appreciated 0.89% against the US dollar. The euro rose 0.77% and sterling 0.50%. The yen fell 1.34%, the weakest of the majors, reversing part of July’s intervention-driven gain.
Exhibit 5: Currency Performance August 2026
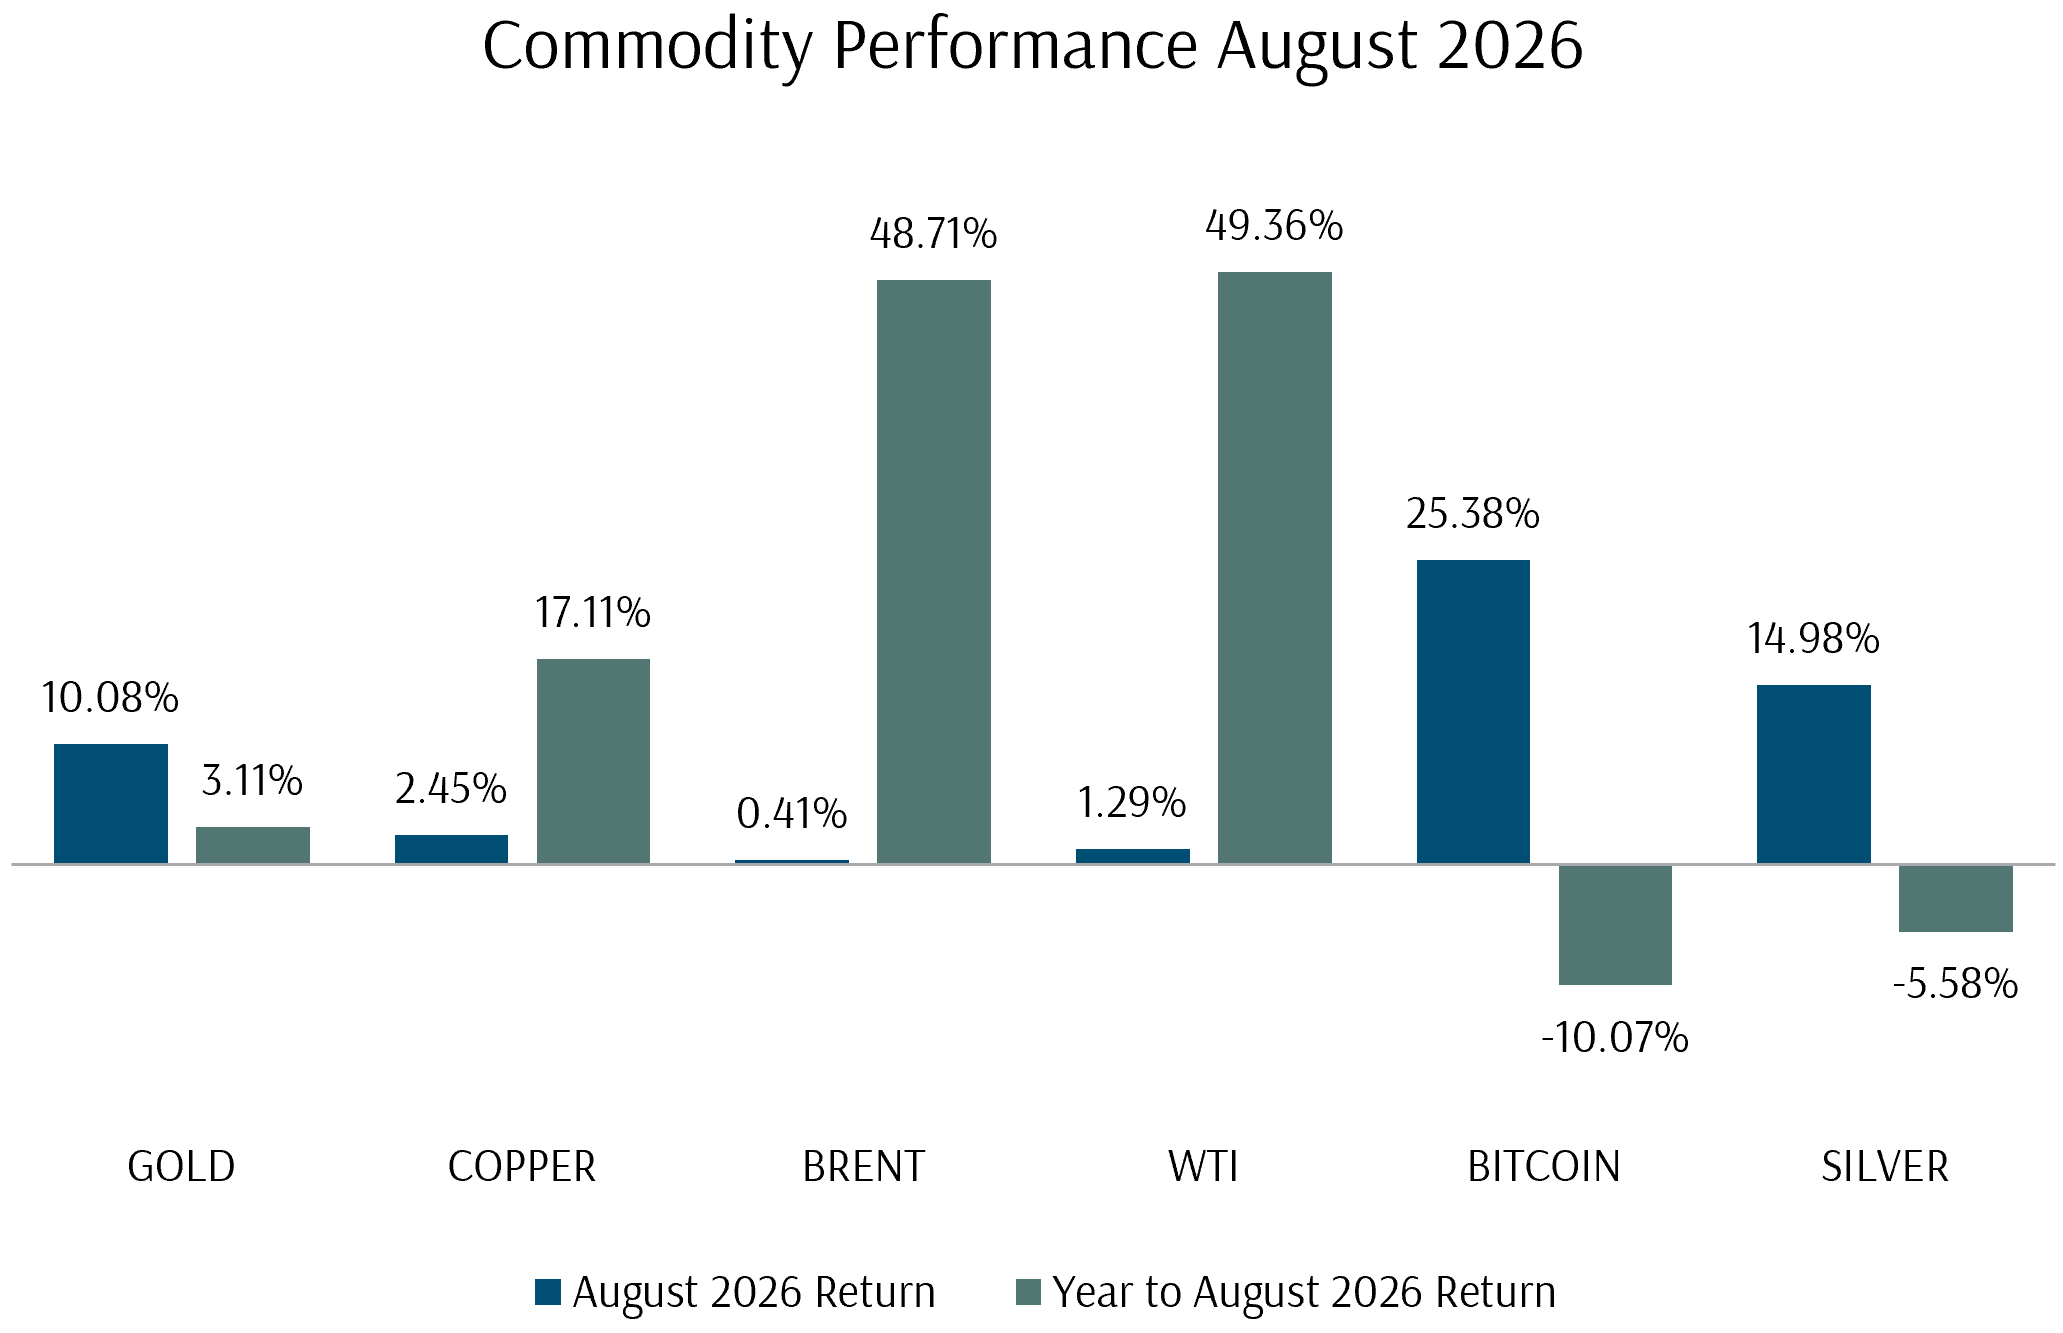
Precious metals and bitcoin led the commodity complex. Gold rose 10.08%, while silver and bitcoin rose 14.98% and 25.38% respectively, recovering a large part of what had been a weak year, largely triggered by US Treasury actions through the month. Copper rose 2.45%. Oil was close to flat, masking large intra-month volatility, with Brent up 0.41% and WTI 1.29%, as flows through the Strait of Hormuz stayed below normal amidst the escalating situation. The gains in gold and silver coincided with the softer dollar and rising attention on government debt management.
Exhibit 6: Commodity Performance August 2026
How Did Our Portfolio Funds Do in August?
Exhibit 7: Equity Fund Performance August 2026 (SGD)
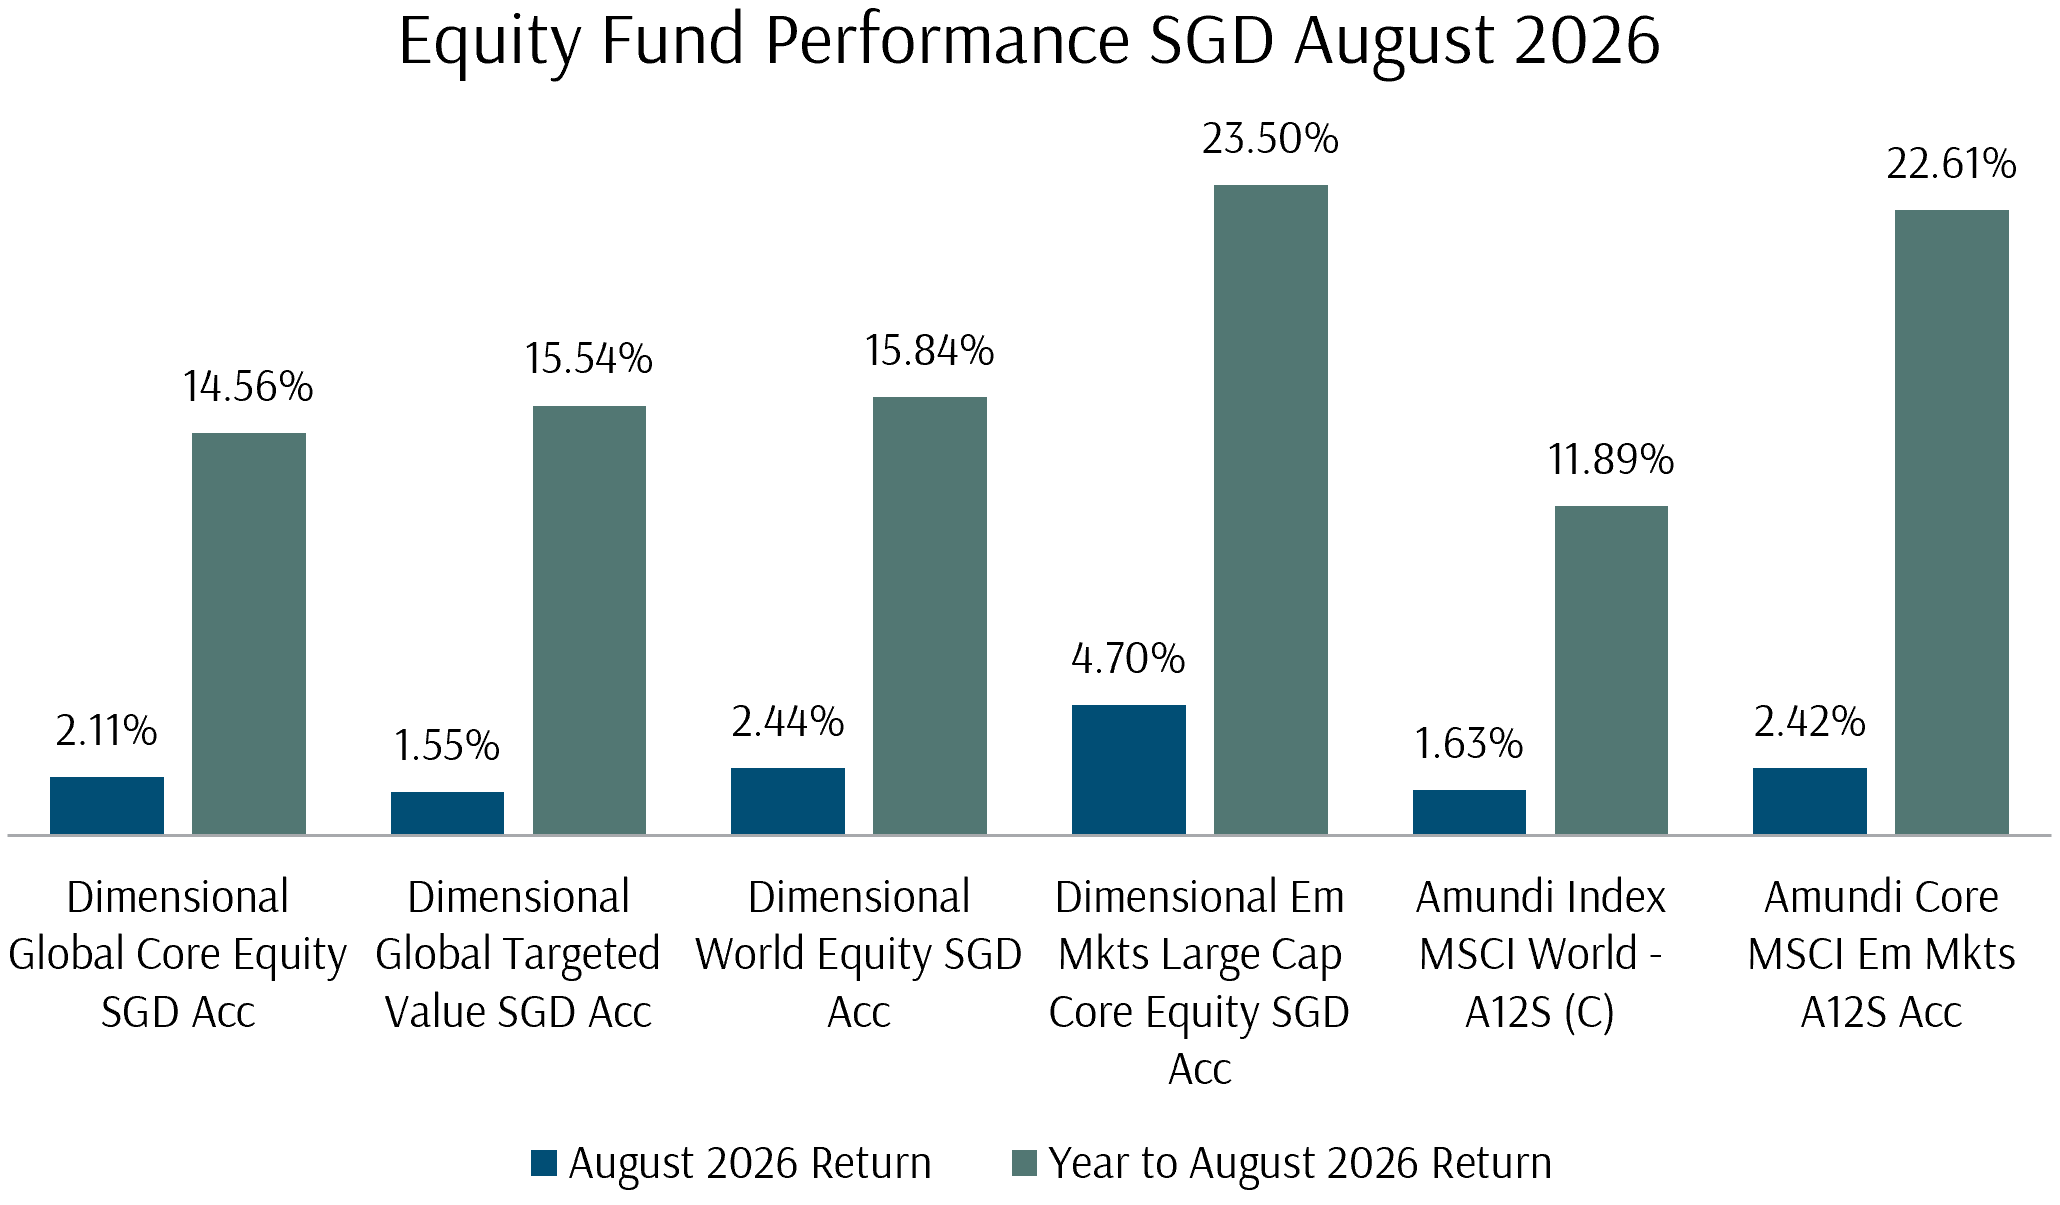
The value factor-tilted funds continued to outperform in August, delivering both solid absolute and relative returns. Small cap tilts fared a little poorer, with the DFA Global Targeted Value Fund returning 1.55% in SGD terms, close to the Amundi MSCI World Index Fund at 1.63%. The DFA Global Core Equity Fund returned 2.11% and the DFA World Equity Fund 2.44%, both ahead of the market-cap world index.
Emerging market funds led. The DFA EM Large Cap Core Equity Fund returned 4.70% and the Amundi Core MSCI EM Fund 2.42%, helped by larger weights in Taiwan and Korea. Year-to-date, the DFA Global Core Equity Fund has returned 14.56% in SGD terms, the DFA Global Targeted Value Fund 15.54% and the DFA EM Large Cap Core Equity Fund 23.50%, with the value and small cap tilts remaining ahead for the year.
Exhibit 8: Fixed Income Fund Performance August 2026 (SGD)
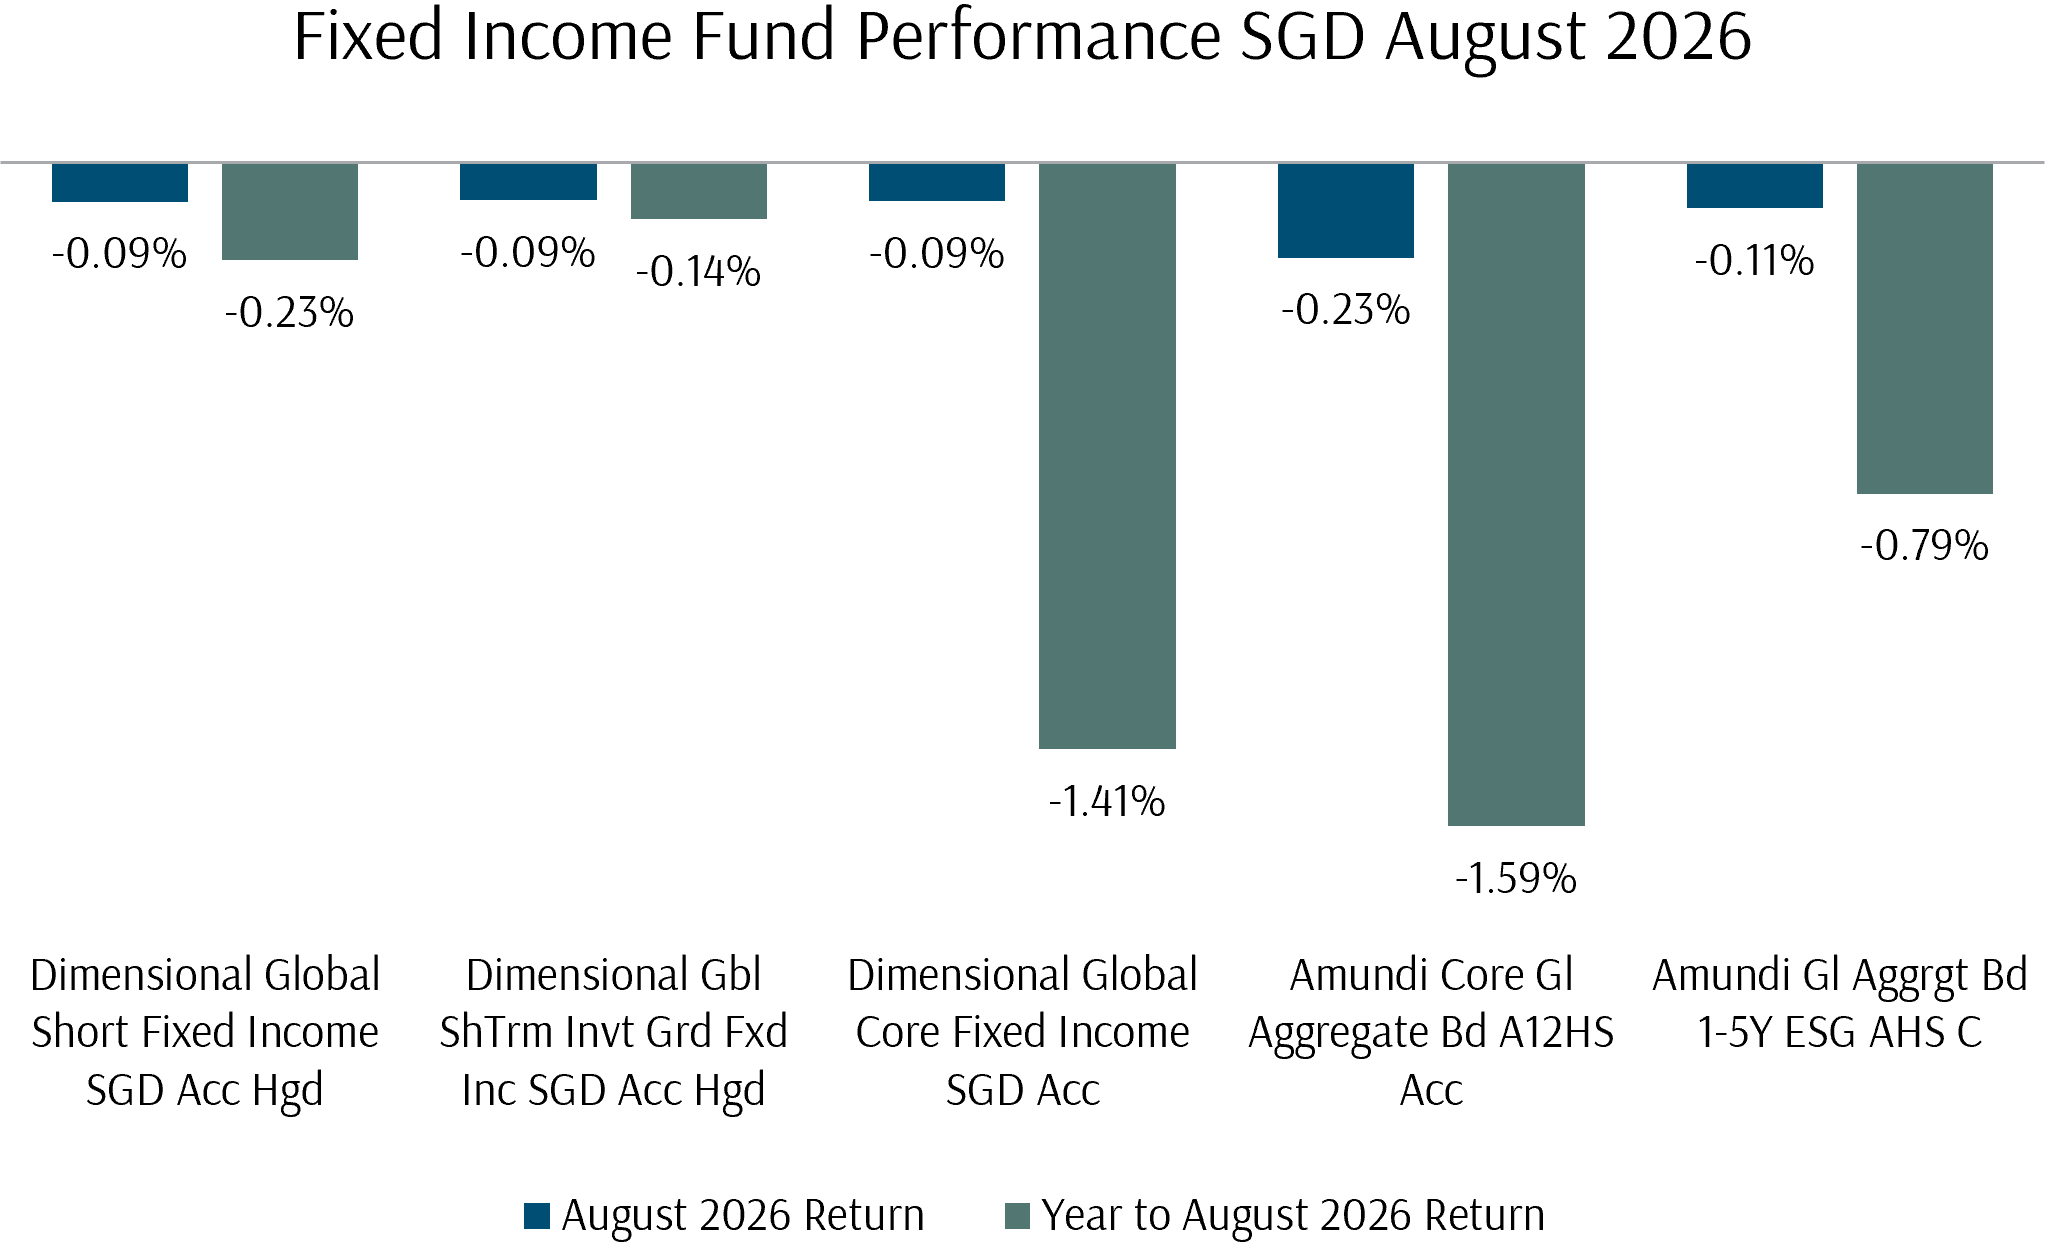
Fixed income funds were close to flat as US yields steadied. The DFA Global Core Fixed Income Fund returned -0.09% in SGD terms and the shorter-duration funds a similar amount, a recovery from July, when rising yields had weighed on returns. The Singapore dollar’s 0.89% appreciation trimmed returns on unhedged SGD share classes.
Investment Questions: The US Dollar, The Long End, and The Yen
Q1: What did the US Treasury announce about the bond market?
On 19 August, the Treasury said it would at least double the size of its buyback operations for longer-dated bonds, namely the ten to thirty-year part of the market. The maximum operation size rises from USD 2 billion to at least USD 4 billion, effective 9 September. Across the seven remaining long-end operations this quarter, that removes at least an additional USD 14 billion of ten to thirty-year supply from the market. Annualised, the larger programme buys back about USD 128 billion a year, up from USD 64 billion, offsetting roughly 30% of gross twenty and thirty-year issuance.
The Treasury is buying back more of its own long-term debt to keep the long end of the market stable while long-term interest rates sit at their highest in years. A thirty-year bond carries an effective duration of about 16, so a 1% rise in yields translates into a price fall of about 16%. Volatility of that magnitude creates risk-management pressure for holders, and the Treasury moved to get ahead of any disorderly selling. As the change came only weeks after the quarterly refunding left buyback sizes unchanged, the market read it as a response to the rise in long-end yields.
Q2: Can the Treasury keep doing this, or could it run out of room?
The programme does not draw on a fixed reserve that can be exhausted. When the Treasury buys back a long-term bond, it raises the cash by issuing short-term bills, so it swaps one maturity for another and leaves the total stock of debt little changed. The operations run on a published schedule several times a quarter, each with a stated maximum size, and the Treasury can make them larger or more frequent as it chooses.
The limits to the programme are thus more practical in nature. The short-term market has to absorb the additional short-term supply, while the Treasury keeps enough cash on hand to cover about a week of outflows, and swapping long bonds for bills shortens the average maturity of the debt and lifts how often the government refinances. At the current scale, analysts judge the extra bill supply digestible. Pushing much further, by raising operation sizes again, cutting long-dated auctions, or retiring the twenty-year bond, would move the pressure into the currency and into short-term rates. Hence, the Treasury has to run the programme with prudence.
Q3: What was the coordinated action on the yen, and why was the United States involved?
Over 30 and 31 July, Japan intervened in the currency market in size to strengthen the yen, and the United States took part alongside. Japan did nearly all of the buying, up to about USD 85 billion over the two days, its largest two-day intervention since 2011. The US role was small, historically about USD 1 billion to 2 billion per operation, and largely symbolic.
Interestingly, the Treasury transacted in euro-yen, selling euro reserves to buy yen, and encouraged Japan to use the Federal Reserve’s FIMA facility. Both choices supported the yen while limiting any knock-on effect on US Treasuries and the dollar. It is likely that the United States saw this as a low-cost way to keep volatility in its own Treasury market contained, with the yen a secondary consideration.
Q4: Does the United States helping Japan sell Treasuries mean the dollar is losing its reserve status?
There is little sign of that. Helping an ally sell part of its Treasury holdings in an orderly way, to support its currency and manage a domestic problem, is a normal use of reserves. Selling reserves to defend a currency is routine, and several reserve managers sold Treasuries to support their currencies in March this year with no objection from the Treasury.
With Japan holding its reserves in dollars and Treasuries, being able to access them smoothly at times of need and obtaining counterparty support to keep the market orderly, is strong evidence that the dollar remains the most reliable reserve currency. The depth and liquidity of the US market let countries build reserves in calm periods and draw on them under stress, which is still hard to replicate elsewhere.
Q5: Is this money-printing by another name?
It shares one feature with quantitative easing, the removal of long-term bonds from the market, but funding mechanisms differ. QE expanded the Federal Reserve’s balance sheet by creating reserves, and paired the bond-buying with a commitment to hold interest rates low. The Treasury funds its buybacks from its own cash or by issuing short-term bills, which leaves the money base unchanged, so the effect on the economy and on inflation is far smaller.
The estimated effect on the level of ten-year yields is modest, on the order of a basis point, with the more visible effect showing up in swap spreads. The related FIMA facility, a standing arrangement that lets foreign central banks raise dollars temporarily by pledging their US Treasuries to the Federal Reserve, works the same way, as a support feature of the dollar system. It has been used in size only once, by the Swiss National Bank during the Credit Suisse takeover in 2023.
Q6: Are these actions a sign the Treasury market is breaking, and could a yen move set off another 2024-style selloff?
The measures of how well the Treasury market is functioning, how easily large trades clear and how closely bonds track fair value, stayed normal through this period. The surprise was the government’s willingness to step in early. The longstanding US structural deficits continue to press on yields and the dollar over time, and this episode is a separate matter from that.
On the yen, the comparison with August 2024 is mixed. Then a fast move in the yen forced investors to unwind carry trades quickly and pulled down markets well beyond Japan, with the yen rising about 11% in a month and the TOPIX falling about 24% peak to trough. Today the setup looks less prone to a sharp yen rise, given the US policy picture and Japan’s fiscal position, so the yen may stay weaker for longer. The possibility of a disorderly move remains, which is why the intervention is being handled carefully.
Q7: What does this mean for my portfolio?
For a globally diversified, long-term portfolio, the answer is to stay the course. The Treasury and Bank of Japan actions are policy tools working as intended to keep markets orderly, and they do not call for a change in a diversified plan.
One development worth holding in mind is the change at the Federal Reserve. With Chairman Warsh committing to that saying less and leaning on higher market yields to do some of the tightening work, future rates become harder to read, which points to more day-to-day volatility around policy meetings.
Looking Forward to September 2026
Markets began September with a modest pullback. In the opening days of the month, the S&P 500 eased 0.25% and the Nasdaq 100 1.06%, with the software shares that had led August giving back some ground, and the MSCI All Country World IMI slipped 0.56%. Gold also came off its highs in the previous month. Generally, these moves were modest against August’s gains and reflected consolidation ahead of a run of policy events.
The near-term macro calendar is eventful, with the August employment report due on 4 September, followed by the August inflation reports and the FOMC meeting on 15 to 16 September. After Jackson Hole, markets price a September rate rise at slightly above even odds, a shift from earlier in the year when rate cuts were expected. Views differ, with some houses still expecting cuts later in the year, which leaves the August data as the deciding input.
Long-term interest rates are a wild-card pressure point. The US 10-year yield rose about 3.6 basis points in the opening days of September, and the Treasury’s larger buyback operations begin on 9 September.
Rate uncertainty and elevated valuations in parts of the technology market remain the main risks. Set against them are broadening earnings growth, a softer dollar, and higher starting yields on the bond allocation, which together support the case for positive returns and for staying invested through the months ahead. Despite this, September and October have traditionally been seasonally weak months. Coupled with the September Trump-Xi summit and the November US midterm elections, some measure of increased volatility over the coming months would be within expectations.
The factor tilts in Providend portfolios cushioned July’s decline and continued to outperform in the August recovery. Despite volatility, rate uncertainty and geopolitical risk looming on the horizon, well diversified investors are more likely to experience a smoother path.
With a comprehensive plan already in place with your Client Adviser, covering near-term spending needs while allocating capital at a level of risk suitable for your longer-term goals, you can have the peace of mind to stay invested for the long term, allowing your wealth to compound and fulfil your ikigai. If you have any questions, please do not hesitate to reach out to your Client Adviser.
The writer of this market review, Glenn Tan, is Senior Portfolio Manager at Providend Ltd, Southeast Asia’s first fee-only comprehensive wealth advisory firm. He is also a CFA Charterholder and a Certified Financial Risk Manager (FRM).
For more related resources, check out:
1. Active Investing That Adds Value to the Client
2. Staying the Course: Investing With Confidence in Uncertain Times
3. Here’s Why We Charge a Higher Fee Than Robos
Download our Investment eBook titled “A More Reliable Way to Get Enough Investment Returns: Even During Times of Market Uncertainty” here.
With a minefield of financial misinformation out there, we promise to be a safe pair of hands and a second pair of eyes to help you avoid costly financial mistakes. Learn more about our investment philosophy here.
We do not charge a fee at the first consultation meeting. If you would like an honest second opinion on your current estate plan, investment portfolio, financial and/or retirement plan, make an appointment with us today.