


October Market Summary
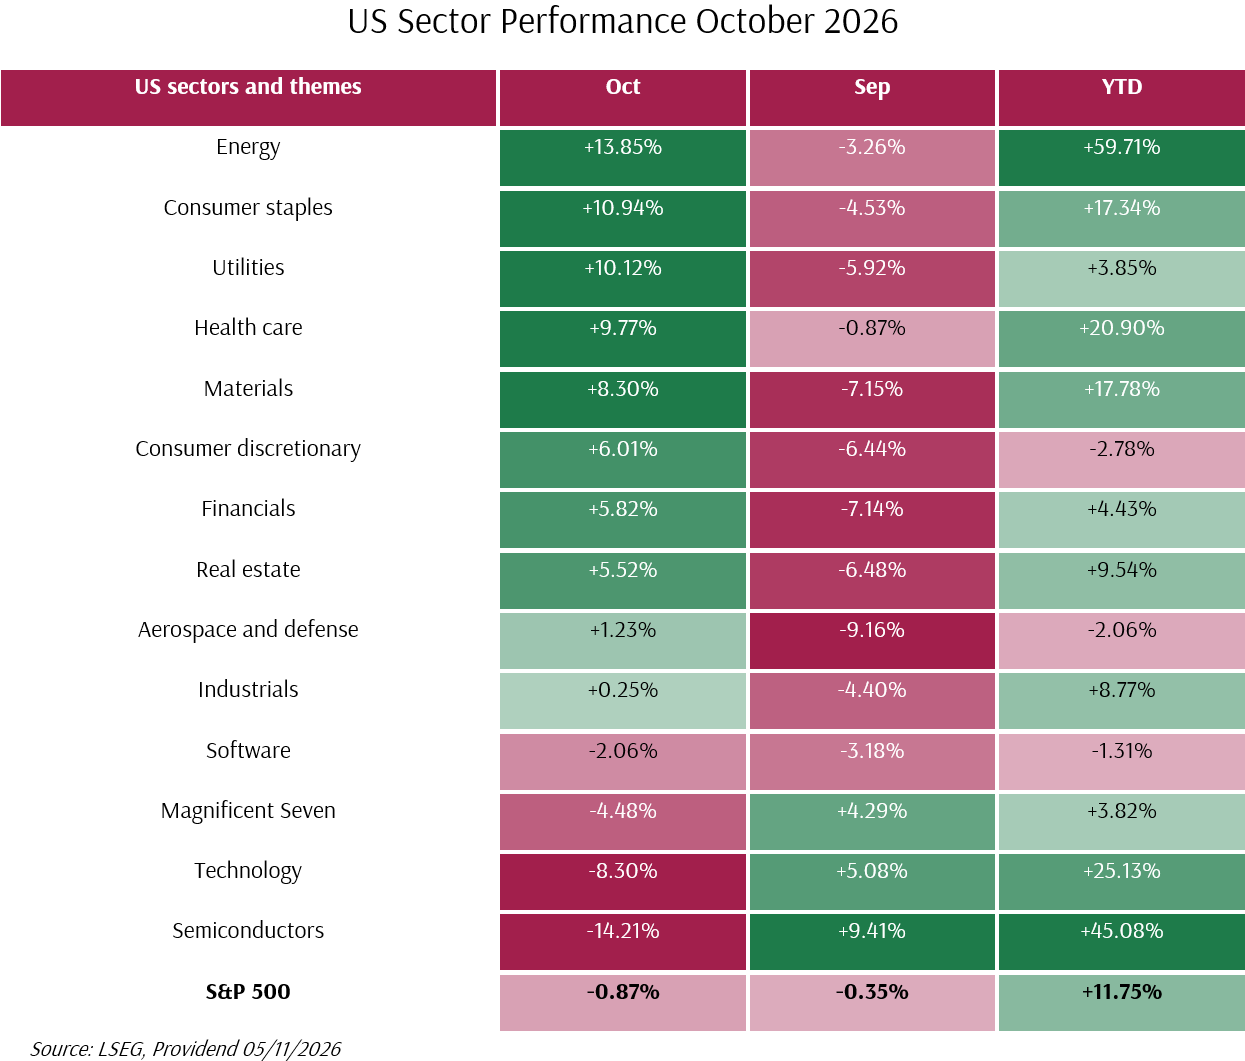
October was a month of turbulent reversals. Despite a strong early start, returns in AI-related sectors turned swiftly later in the month, drastically underperforming other sectors. Losses in technology and Asian chip markets outweighed strong gains elsewhere, with the Nasdaq 100 falling 6.63%, its weakest month since March 2025. The S&P 500 slipped 0.87%, while the Dow Jones Industrial Average and the Russell 2000 both rose. Ultimately, the MSCI All Country World IMI fell 1.56% for the month.
Earnings reports dominated the headlines, as Meta, Alphabet and Amazon reported third-quarter capital spending well ahead of free cash flow, and credit spreads widened for the most indebted AI borrowers as bond markets fund a growing share of the build-out. Semiconductors and other technology hardware-related shares led the declines. Yet, 10 of the 14 US sectors and themes we track rose, with energy, consumer staples, utilities and health care at the top of the table, highlighting the contrasting fortunes in October.
On the macro front, the Federal Reserve held rates steady, after having hiked in September, with two members preferring another increase while other members decided to stand pat, despite September core inflation surprising to the upside for a second month in a row.
Chairman Warsh later expressed his view that “policy is working”, leading to a modest downgrade in market rate hike expectations and propelling a strong rally in bond markets. The US 10-year Treasury yield, which reached its highest level since 2007 early in the month, reversed sharply, falling to about 4.93%, albeit aided by a “flight-to-safety” effect as equities experienced turbulence through the month.
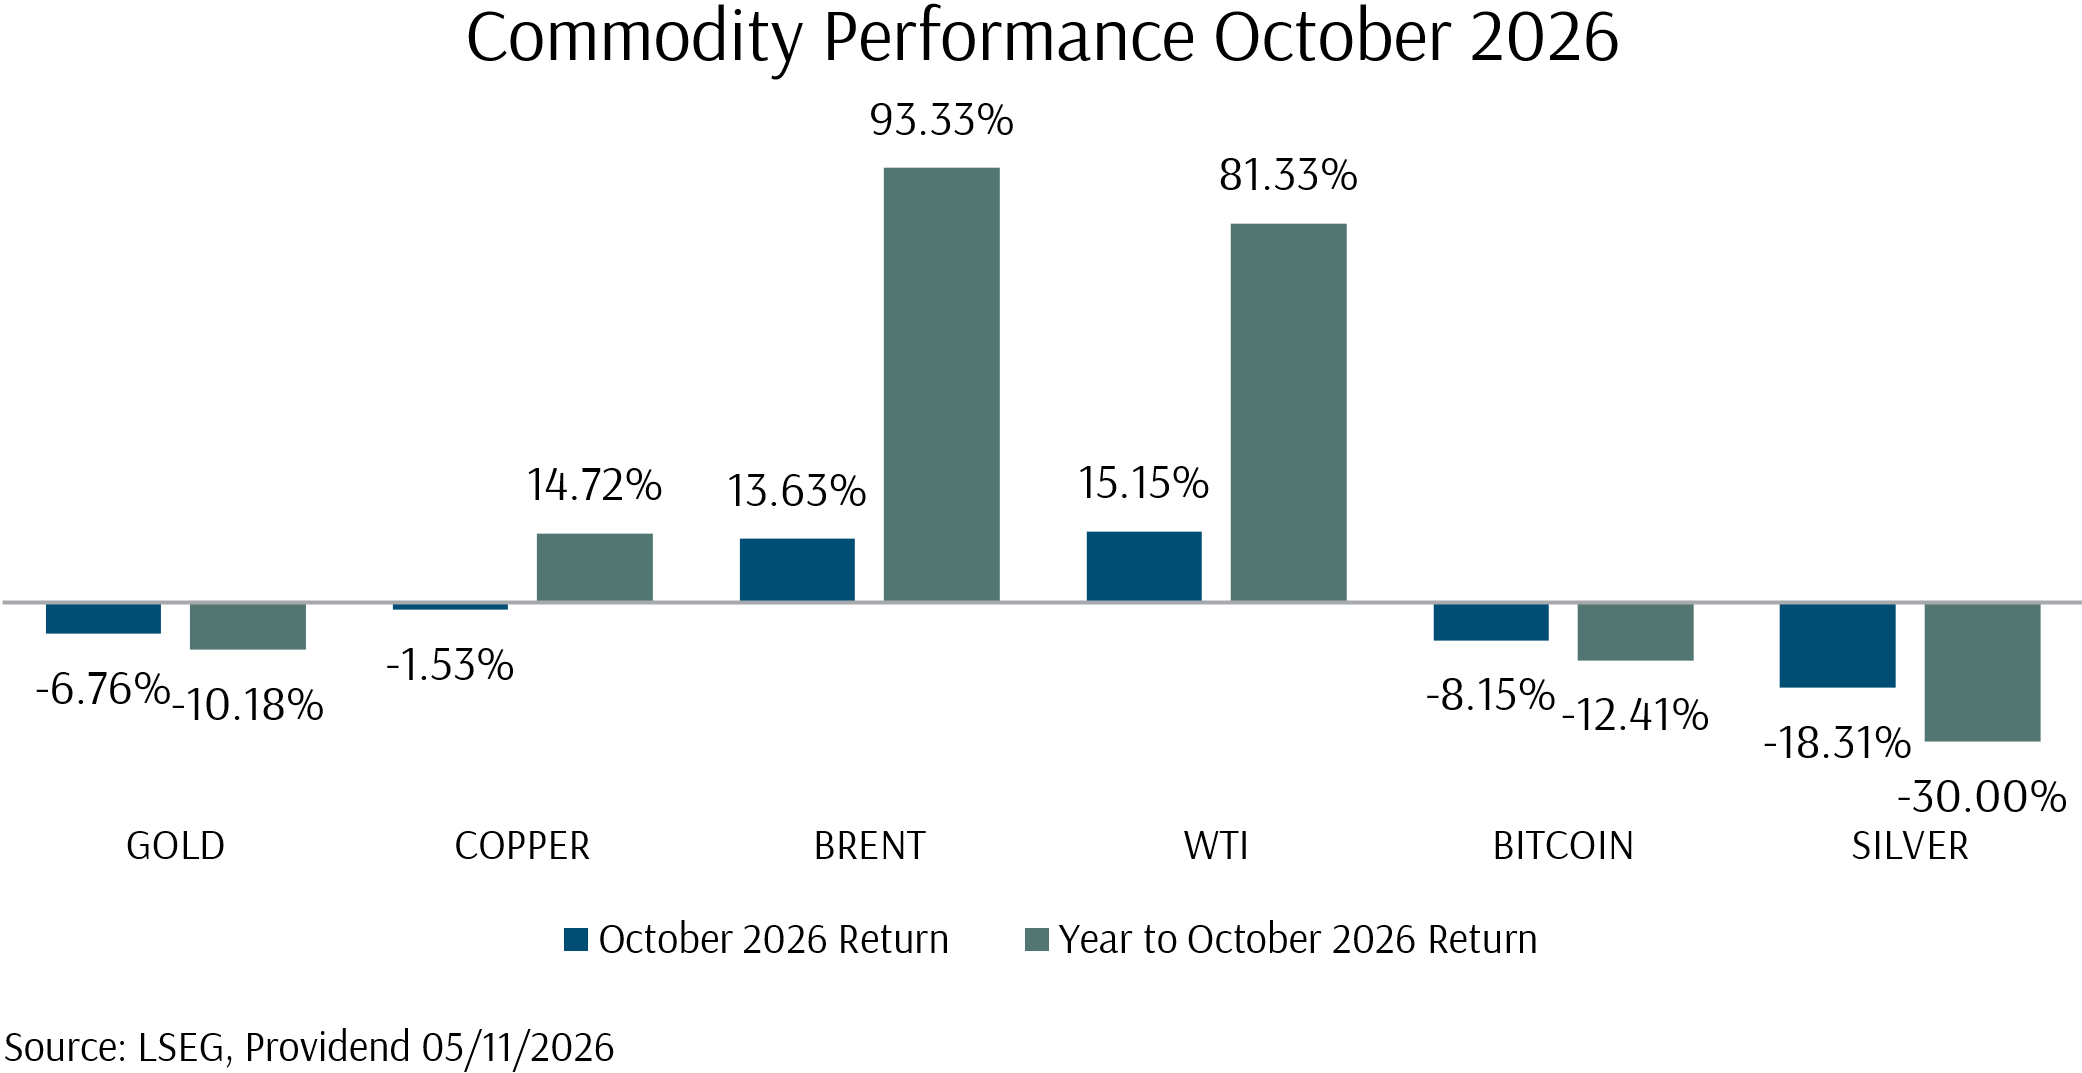
In other markets, crude oil rose 13.63% after attacks on Saudi targets and on tankers near the Strait of Hormuz, while gold, which in recent days, has tended to trade in opposite directions to oil prices, fell 6.76%, another casualty amid the swift deleveraging in the AI complex.
The month’s furious rotations favoured value companies by a wide margin. In the US, large cap value stocks rose 4.93% and large cap growth fell 5.48%, a massive gap of about 10 percentage points. Small cap value also outperformed small cap growth.
Asia felt the chip sell-off most. Korea and Taiwan, the region’s main AI hardware markets, led emerging markets lower. Greater China and Singapore also declined, as policy expectations and increasingly negative sentiment on banks respectively impacted markets.
Providend portfolios outperformed in October. The value and small cap tilts in Dimensional funds worked in our favour, with the DFA Global Targeted Value Fund returning 4.23% in SGD terms against a return of -0.75% for the Amundi MSCI World Index Fund, and fixed income funds returning between 0.52% and 1.50% as yields fell. Despite the extensive market turbulence, the impact on our portfolios was much less pronounced.
This month’s investment questions examine the turbulence in the AI and technology sectors in general. On balance, while AI spending is expected to keep rising, a slower pace of growth is all but certain and investors are paying much closer attention to returns on capital expenditure. While the Fed Chair has been slightly more dovish than expected, interest rate hikes are still expected in 2027.
Looking ahead, November has opened with a Democratic sweep of Congress in the midterm elections. After an initial knee-jerk reaction to the downside, equities rewarded the results with a strong rally. Oil fell more than USD 10 a barrel, alongside expectations of a wind-down in conflict with Iran, and gold swiftly rose back above USD 4,000, while tech shares continued to be punished on the back of expected Democratic moratoriums on data centre build-outs.
Equity Market Performance
US Equities
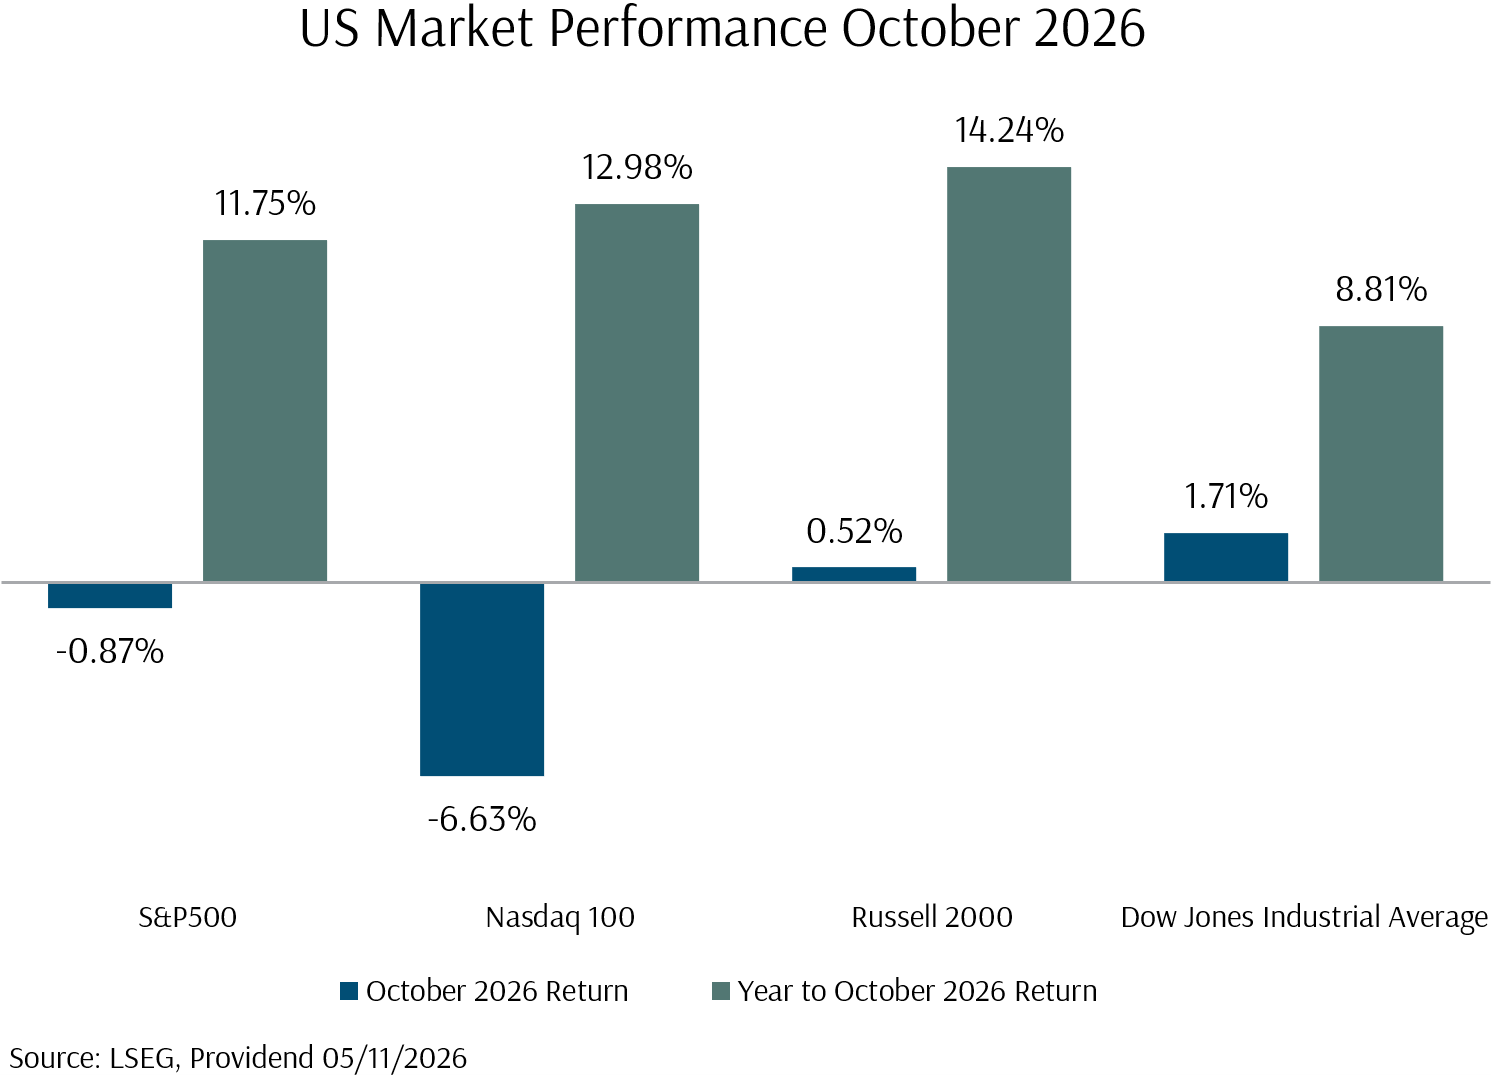
The S&P 500 fell 0.87% in October and the Nasdaq 100 fell 6.63%, while the Dow Jones Industrial Average rose 1.71% and the Russell 2000 rose 0.52%. Year-to-date, the Russell 2000 is up 14.24%, ahead of the Nasdaq 100 at 12.98% and the S&P 500 at 11.75%.
Energy rose 13.85%, consumer staples 10.94%, utilities 10.12%, health care 9.77% and materials 8.30%. Semiconductors fell 14.21%, technology 8.30% and the Magnificent Seven 4.48%, after leading in September. Software fell 2.06%, with ServiceNow down 27.0% on 29 October after guiding to slower growth in contracted revenue.
On the macro front, nonfarm payrolls rose 29,000 in September against expectations of 90,000, with downward revisions of 60,000 to the prior two months, and the unemployment rate rose to 4.2%. Energy prices rose 5.2% on the month, core CPI rose 0.33% month-on-month, and the producer price index rose 1.3%. Third-quarter GDP grew at an annualised 3.4%, above the 3.2% consensus, led by consumer spending and AI-related business investment, and core PCE inflation, the Fed’s preferred measure, rose to 3.1% year-on-year.
Growth remained narrowly based. Real consumer spending was flat in September and residential investment declined 3.4% in the third quarter, with mortgage rates at about 7.3%. Hyperscaler capital spending has so far shown little sensitivity to interest rates, leaving housing, durable goods and smaller businesses to absorb most of the effect of higher borrowing costs.
Exhibit 1: Us Stock Market Performance October 2026 (USD)
International Equities
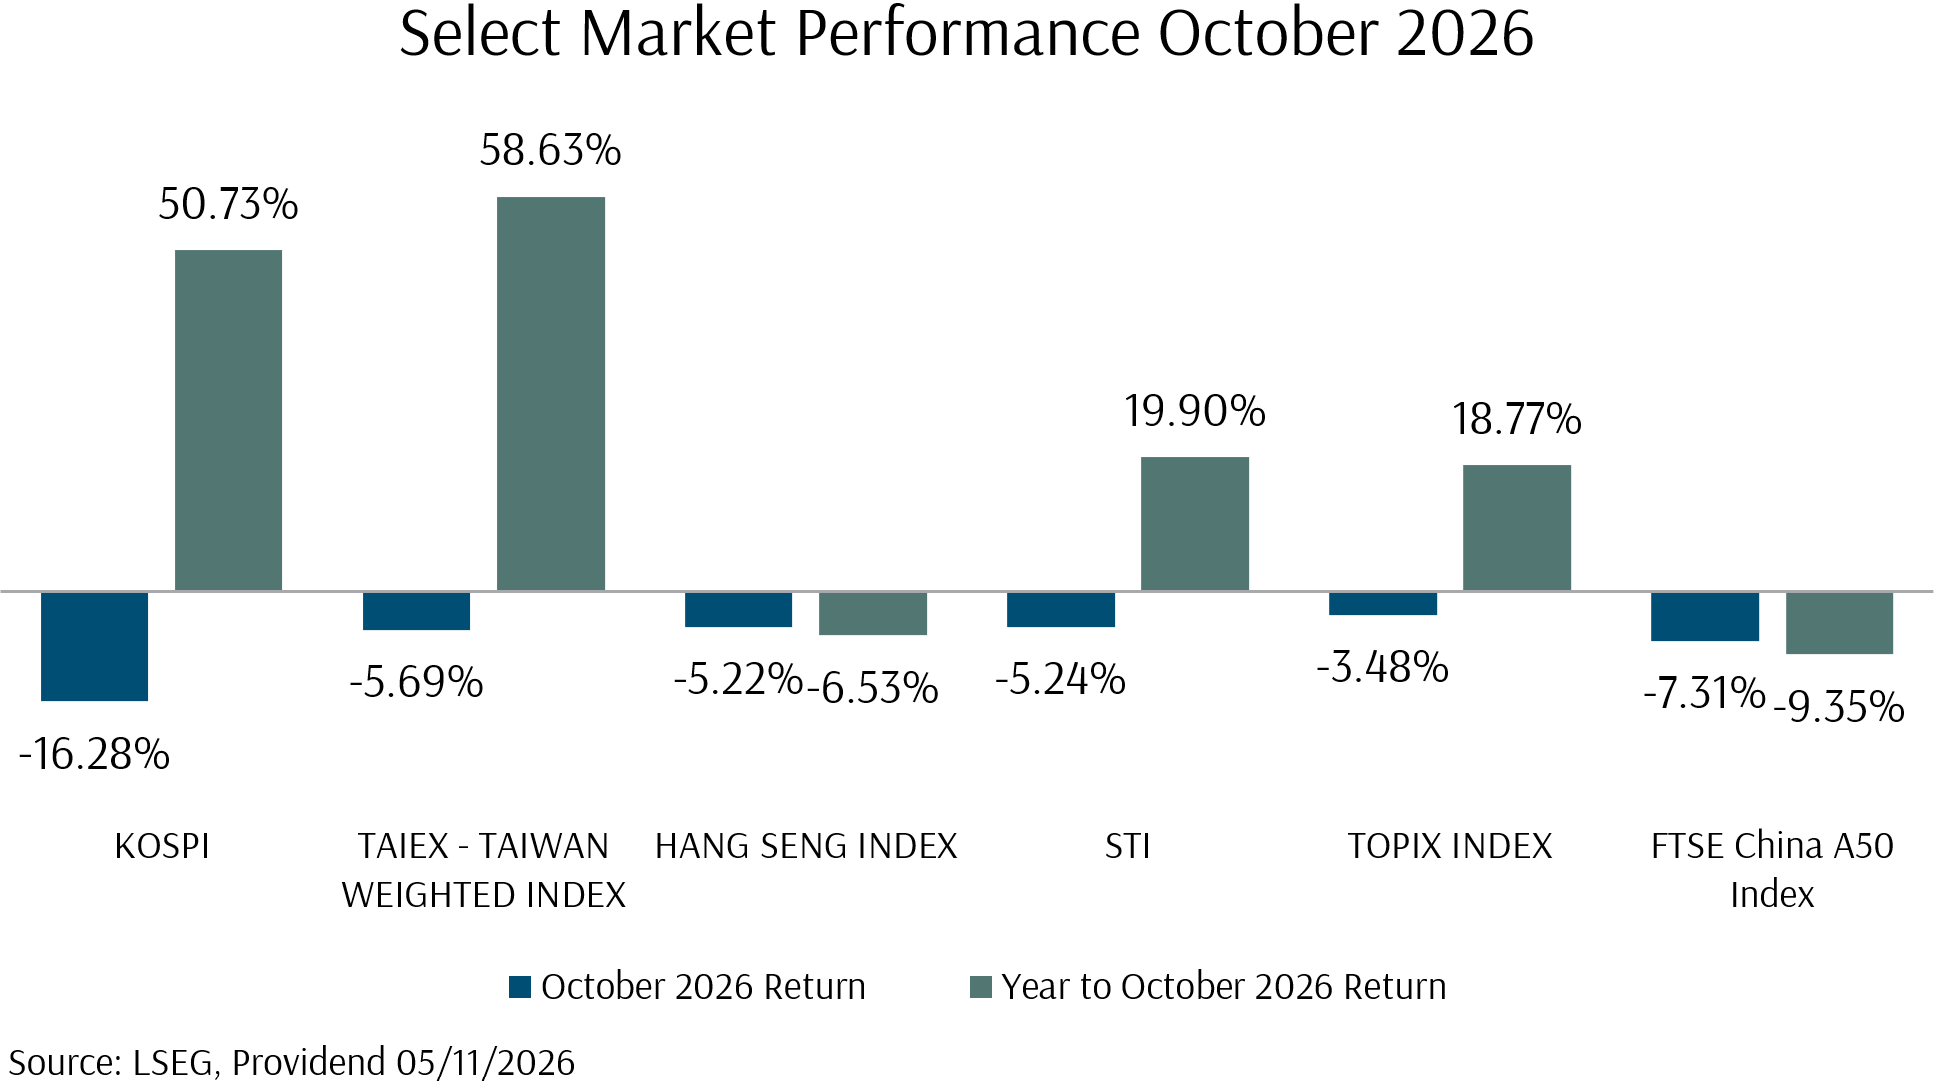
Korea’s KOSPI fell 16.28%, including a 14.5% decline in the week to 16 October, as forced selling of leveraged retail ETFs added to foreign outflows. Taiwan’s TAIEX fell 5.69%. However, both markets remain well ahead for the year, with gains of 50.73% and 58.63% respectively.
The FTSE China A50 fell 7.31% and the Hang Seng fell 5.22%, leaving both lower for the year. Singapore’s STI fell 5.24%, with the local banks falling 7% to 10% over three trading days in early October on concerns over capital, deposit competition, mortgage repricing and wealth fees. Japan’s TOPIX fell 3.48%. The Monetary Authority of Singapore left policy unchanged on 14 October, against market expectations of further tightening, and the Singapore economy grew 5.4% year-on-year in the third quarter.
Exhibit 2: Select Market Performance October 2026 (Local Currency)
Global Summary
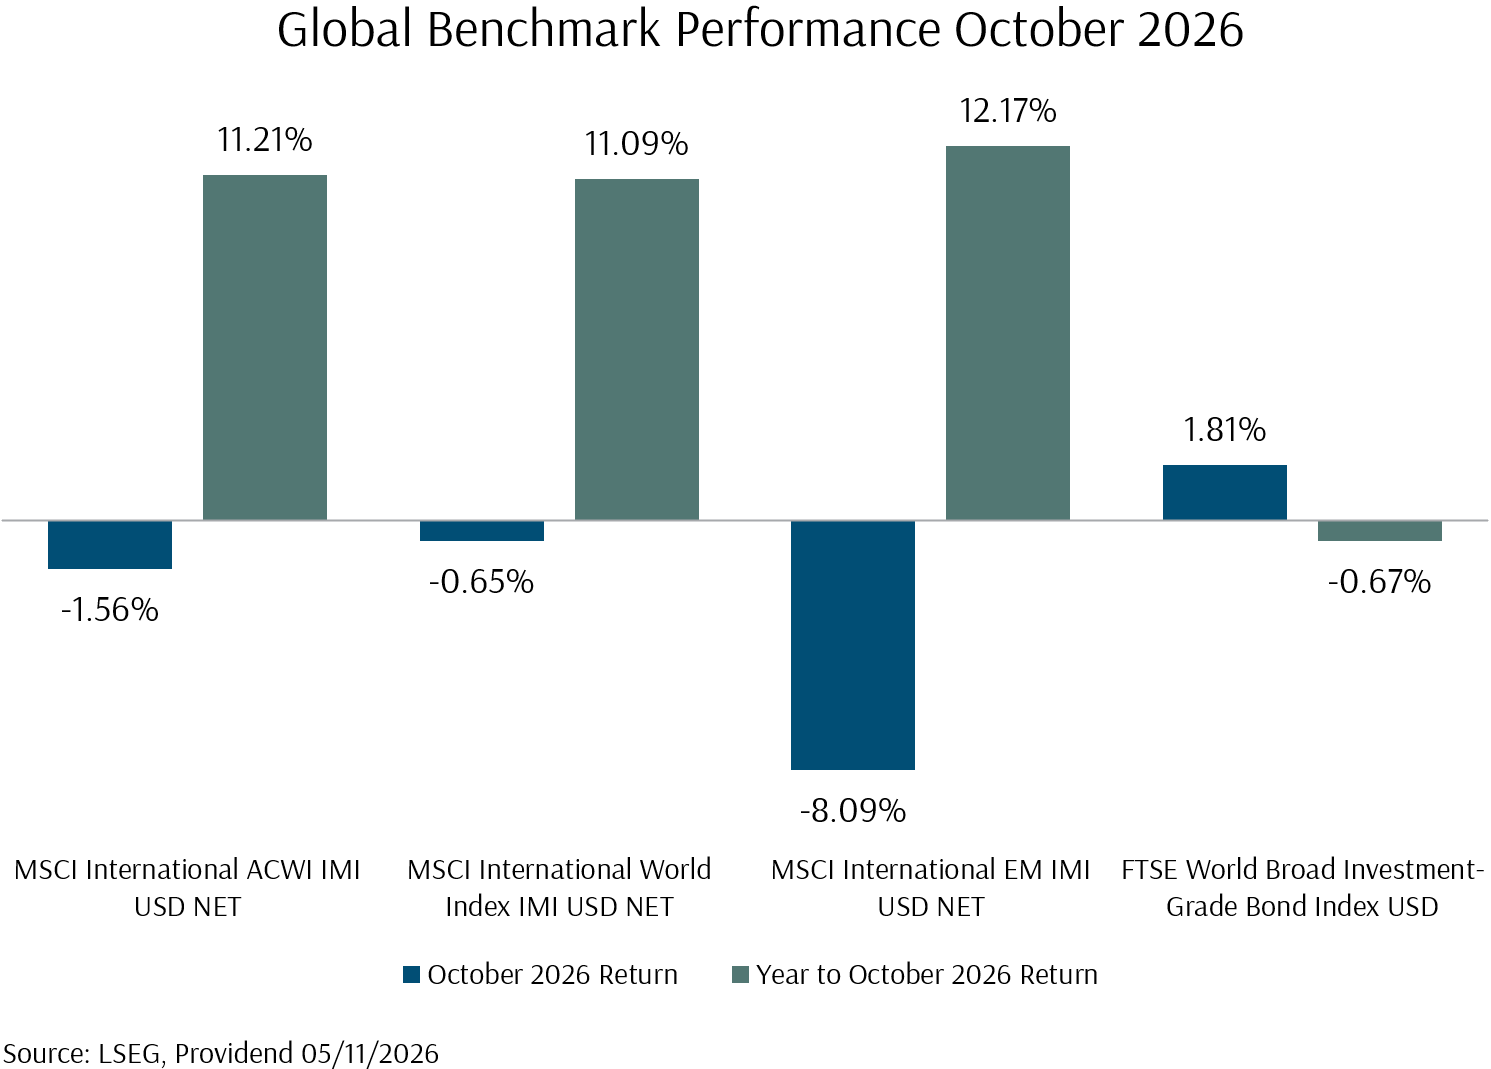
The MSCI All Country World IMI returned -1.56% in October, with the MSCI World IMI down 0.65% and the MSCI EM IMI down 8.09%. Year-to-date, the MSCI ACWI IMI is up 11.21% and the MSCI EM IMI is up 12.17%, its lead over developed markets narrowing from about 10 percentage points at the end of September to about 1 percentage point.
Exhibit 3: Global Equity Benchmark Index Performance October 2026 (USD)
Cross-Asset Performance
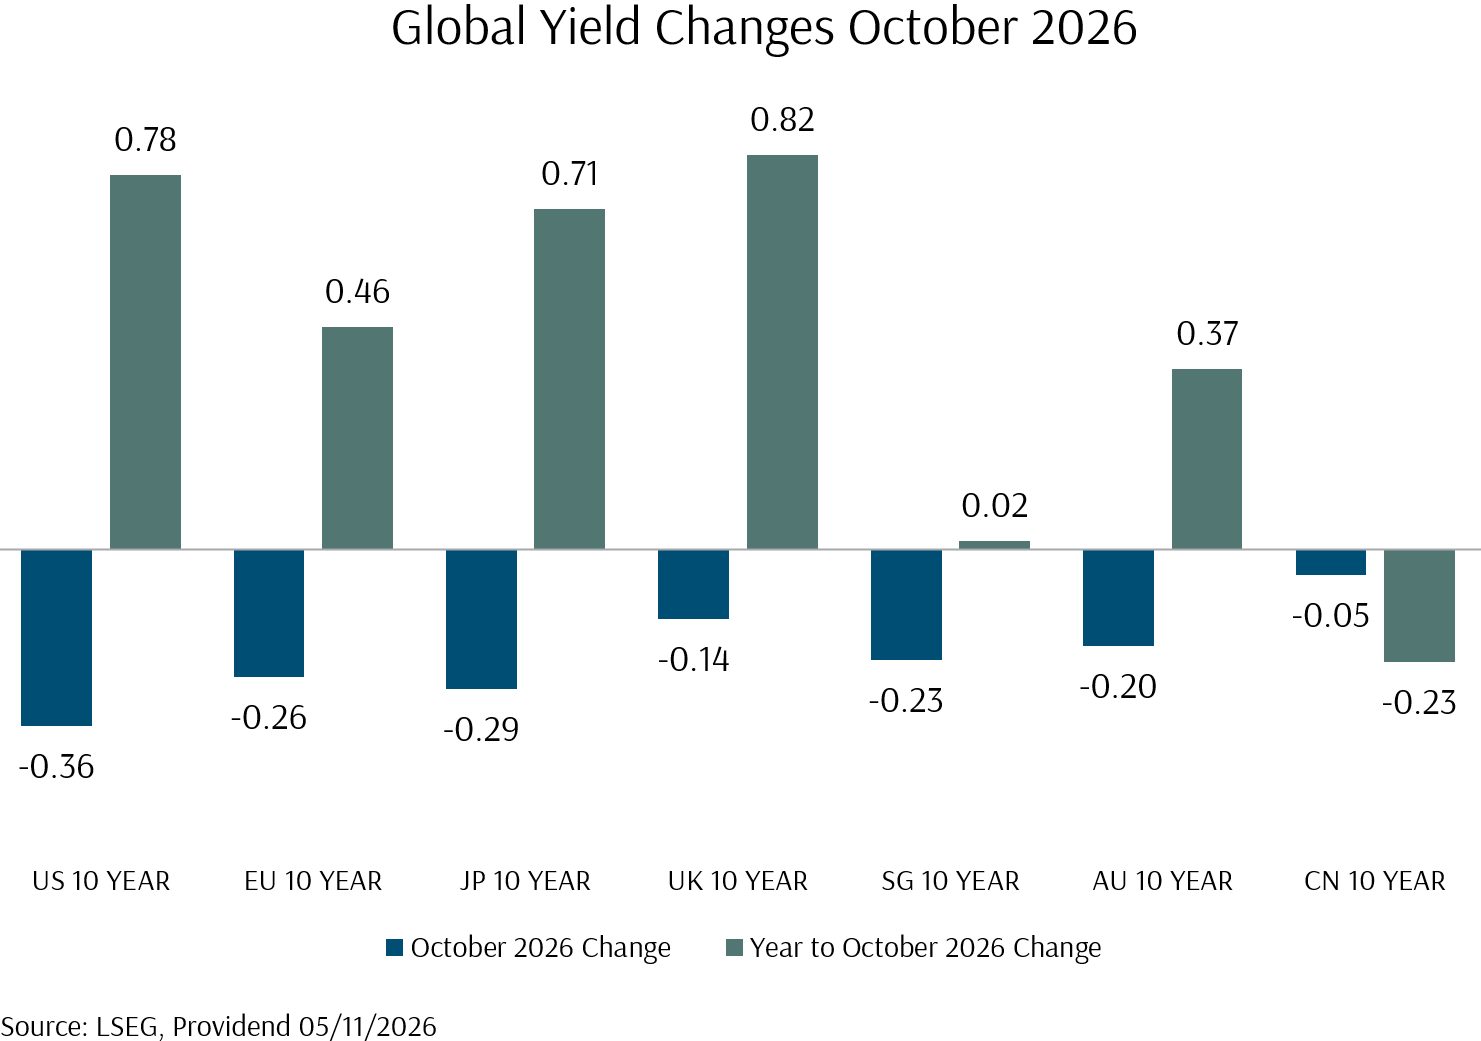
The US 10-year Treasury yield fell 36.4 basis points in October, after touching about 5.35% on 7 October. Japan’s 10-year yield fell 28.7 basis points, the euro area’s 26.3 basis points, Singapore’s 22.8 basis points and Australia’s 19.9 basis points, while the UK’s fell 14.3 basis points and China’s 5.2 basis points. The FTSE World Broad Investment-Grade Bond USD Index returned 1.81%, narrowing its year-to-date loss to 0.67%. In credit, spreads on AI-related US high-yield bonds widened to 360 basis points in mid-October while spreads for other issuers were little changed. Global corporate bond spreads widened to 129 basis points on 23 October, amid market turbulence.
Exhibit 4: Global Yield Changes October 2026
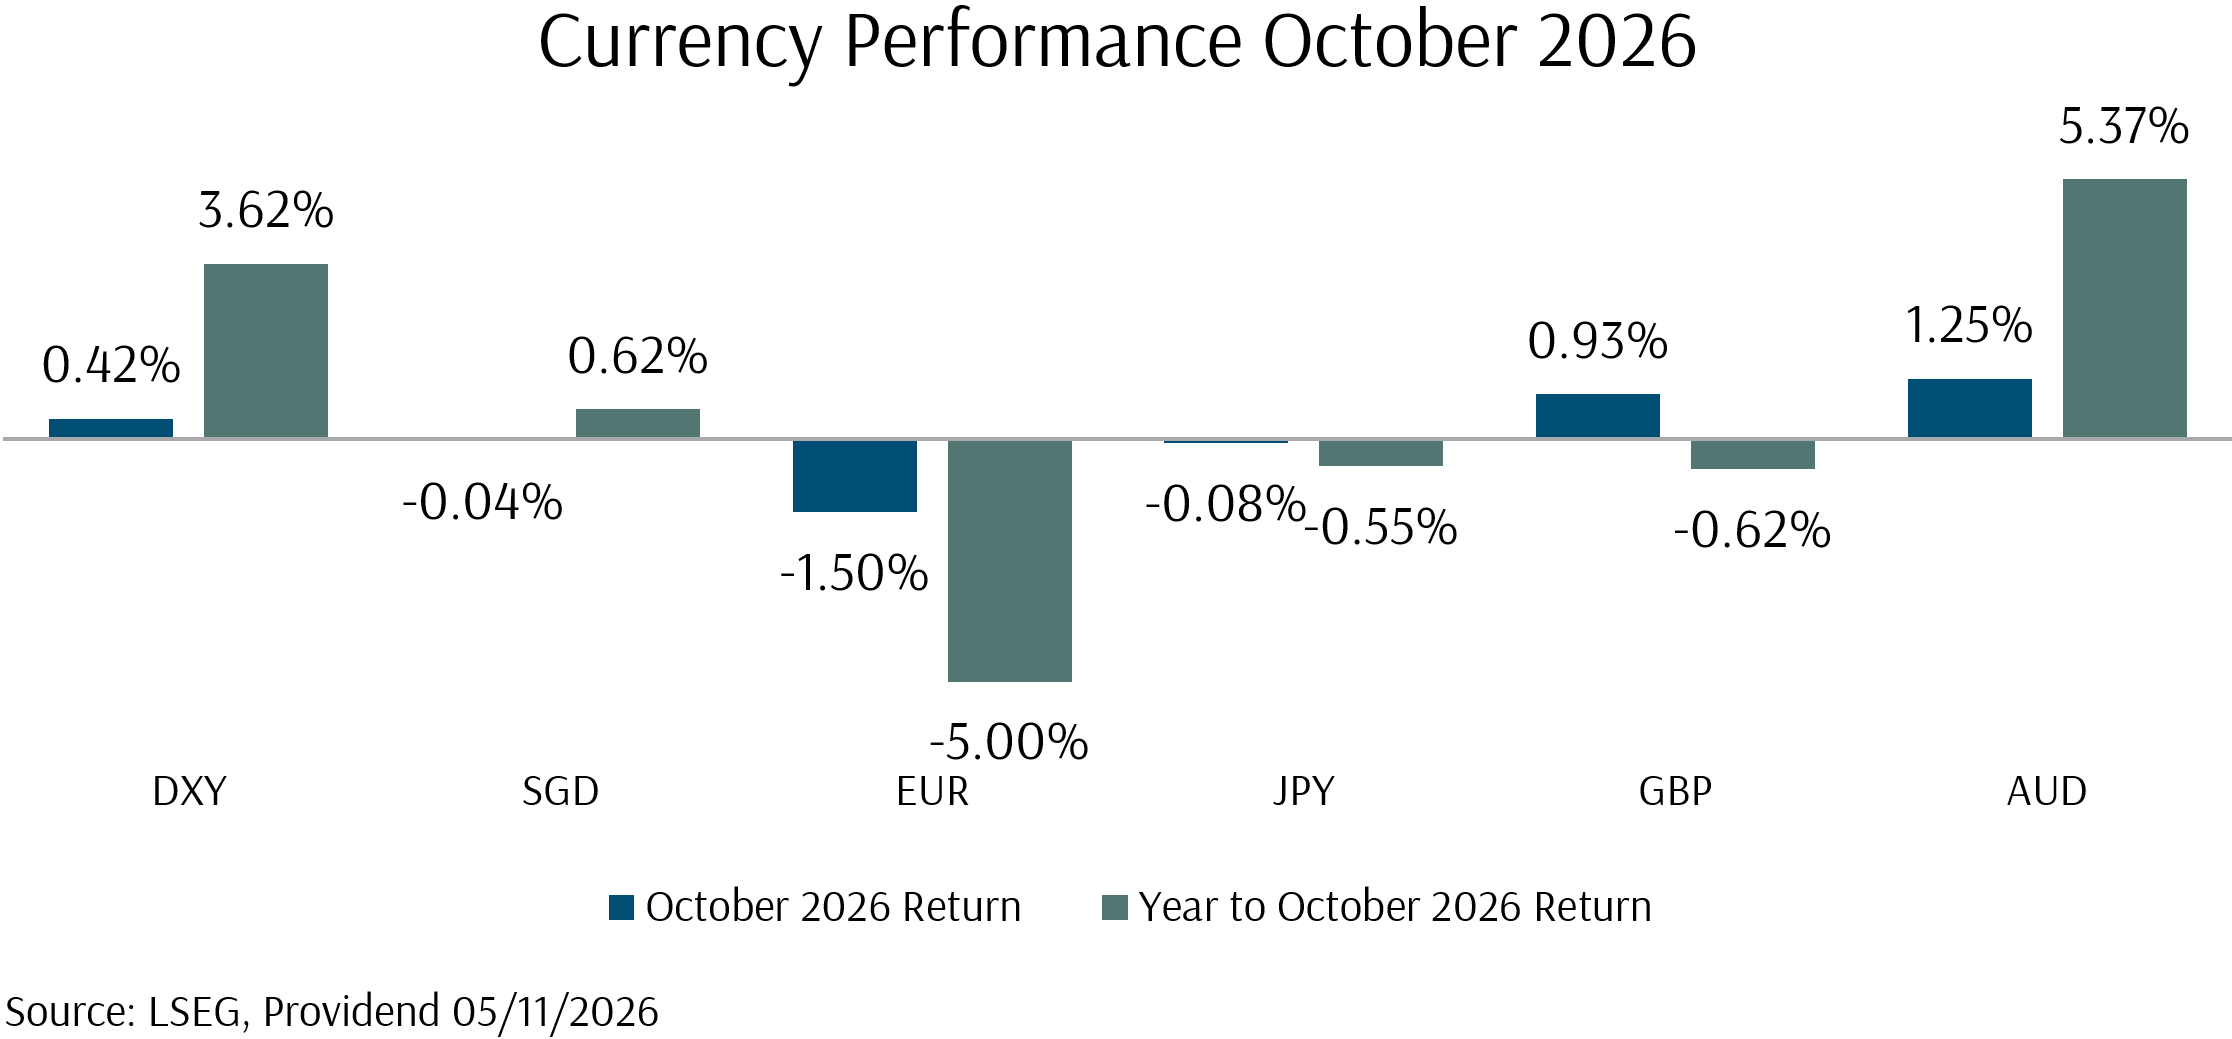
The US Dollar Index rose 0.42%. The Australian dollar rose 1.25% and sterling 0.93% against the US dollar, while the euro fell 1.50% and the yen eased 0.08%. The Singapore dollar was down 0.04%, after MAS left its policy settings unchanged.
Exhibit 5: Currency Performance October 2026
WTI rose 15.15%, alongside Brent, taking year-to-date gains for the two benchmarks to 81.33% and 93.33% respectively. Gold is 10.18% lower for the year, while silver fell 18.31% and copper fell 1.53%. Bitcoin fell 8.15% alongside technology shares and is 12.41% lower for the year.
Exhibit 6: Commodity Performance October 2026
How Did Our Portfolio Funds Do in October?
Exhibit 7: Equity Fund Performance October 2026 (SGD)
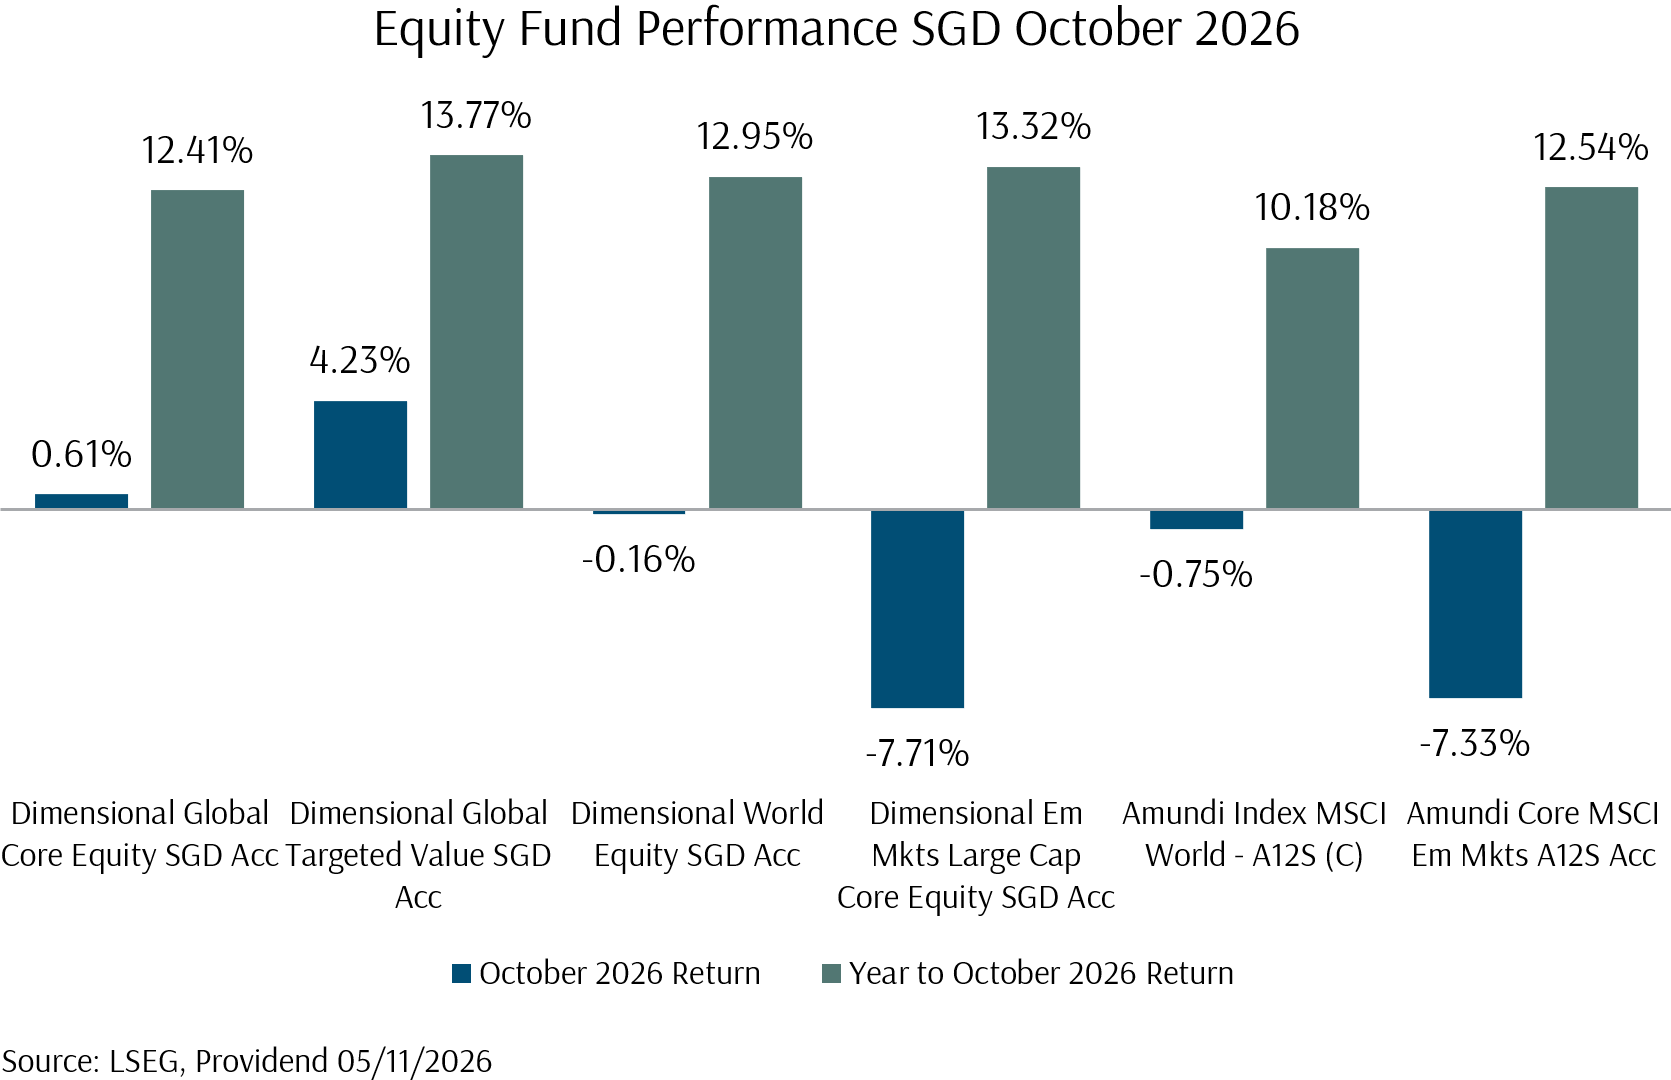
The DFA Global Core Equity Fund returned 0.61% in SGD terms and the DFA World Equity Fund -0.16%, while the DFA Global Targeted Value Fund’s October return outperformed dramatically, more than reversing its September shortfall against the Amundi MSCI World Index Fund. The Amundi Core MSCI EM Fund returned -7.33%.
Year-to-date, the DFA Global Core Equity Fund has returned 12.41% in SGD terms, against 10.18% for the Amundi MSCI World Index Fund, while the DFA Global Targeted Value Fund has returned 13.77% and the DFA EM Large Cap Core Equity Fund 13.32%, against 12.54% for the Amundi Core MSCI EM Fund. The greater-than-market diversification and factor tilts have kept DFA funds ahead of their benchmark indices for the year.
Exhibit 8: Fixed Income Fund Performance October 2026 (SGD)
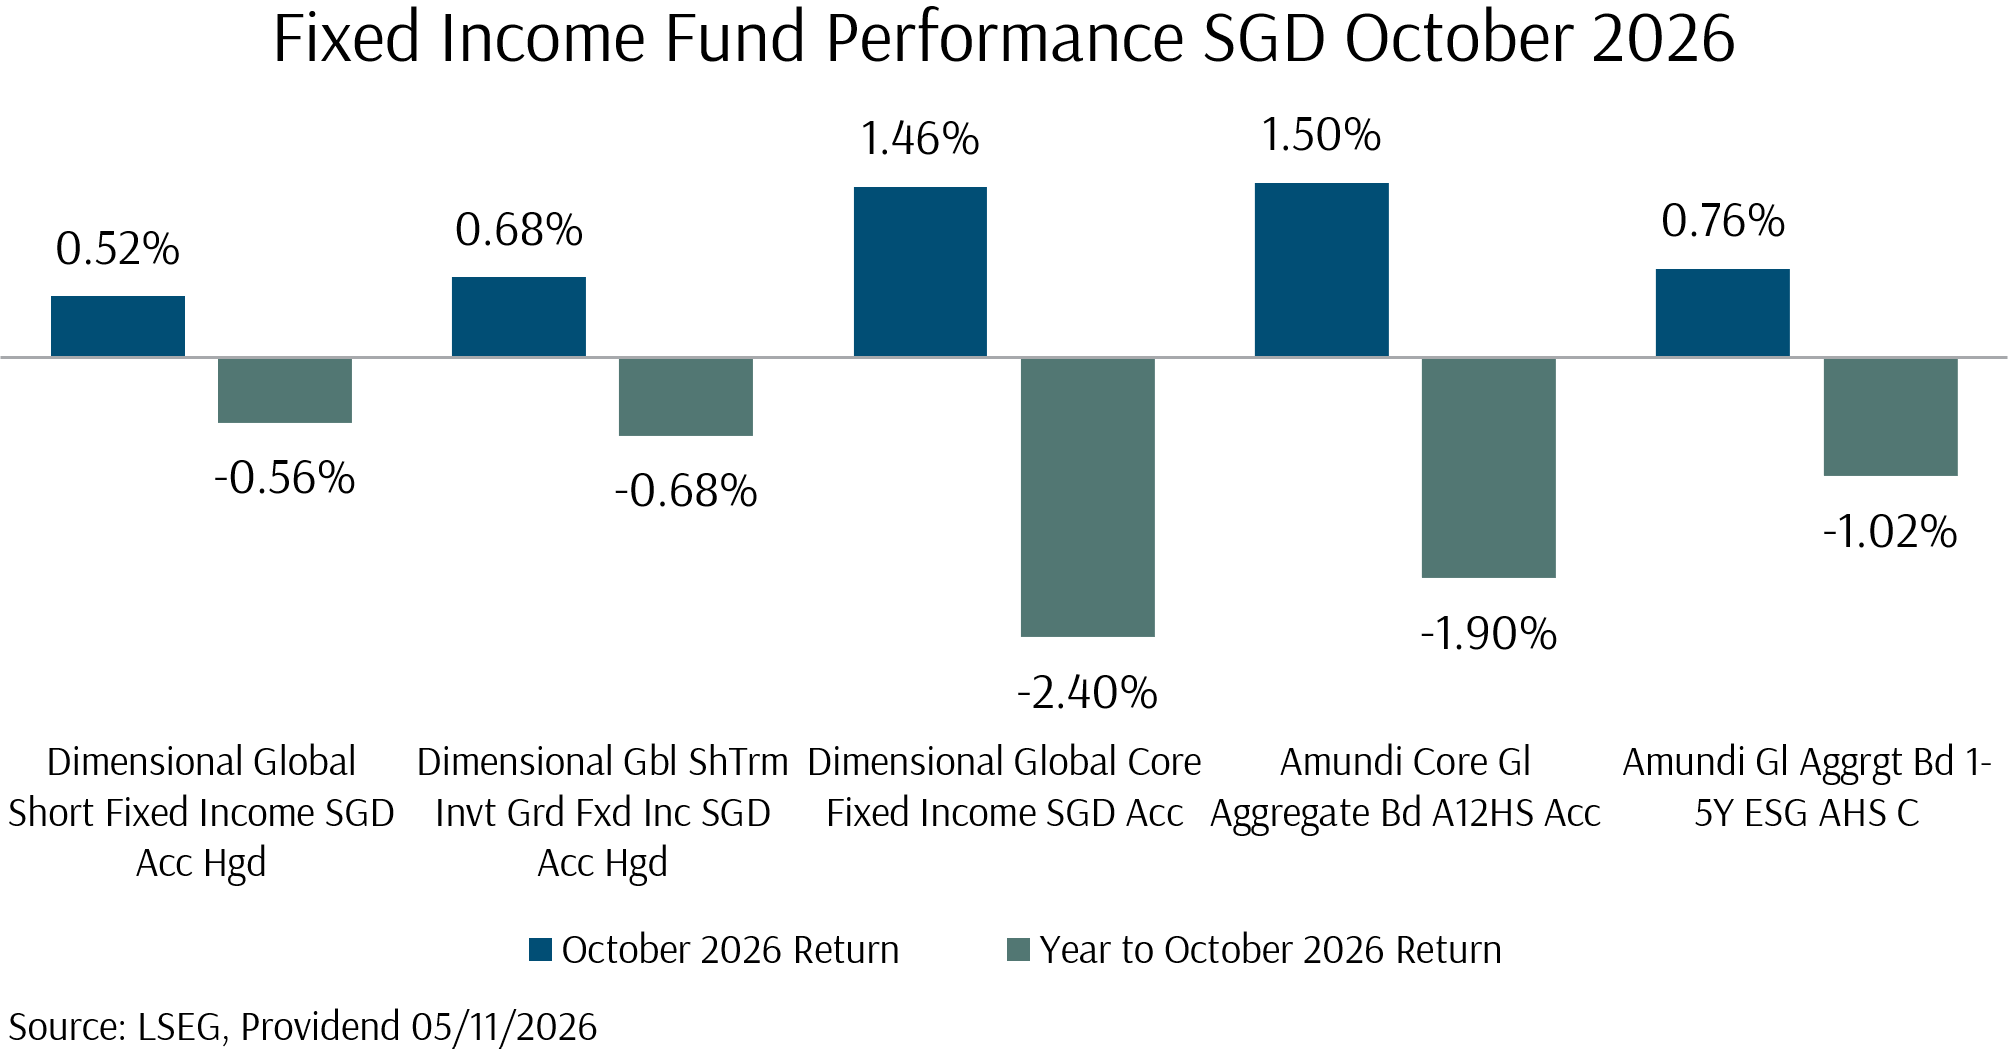
Duration drove the differences in fixed income returns. The DFA Global Core Fixed Income Fund returned 1.46% in SGD terms and the Amundi Core Global Aggregate Bond Fund 1.50%, while the shorter-duration DFA Global Short Fixed Income Fund returned 0.52% and the DFA Global Short-Term Investment Grade Fixed Income Fund 0.68%.
Investment Questions: AI Spending, Credit and the Fed
Q1: Why did AI shares fall in October?
Rising rates, weaker than expected revenue at OpenAI, stress in AI-related credit and negative free cash flow at the largest spenders were negative catalysts in October. On 8 October, OpenAI’s annualised revenue was reported at about USD 50 billion, against a widely cited USD 68 billion. September inflation data lifted the odds of further Fed hikes, which also drove credit spreads sharply higher. By 15 October, bonds issued by CoreWeave, a specialist GPU cloud provider, yielded about 15%. The Philadelphia Semiconductor Index fell 11.4% in the week to 16 October.
A relief rally from 26 to 28 October, helped by Anthropic’s listing filing and the Fed decision, reversed on 29 October, when Alphabet fell 12.6% after reporting negative free cash flow. Microsoft, whose capital spending came in 13% below estimates, was little changed after its results.
Q2: How are the largest technology companies paying for AI?
Debt and equity markets are filling the gap between capital spending and operating cash flow. Meta’s quarterly capital spending of USD 34.9 billion exceeded its operating cash flow of USD 32.8 billion, and it raised USD 37.5 billion through common and preferred shares in late October, with Nvidia committing USD 3 billion. Alphabet’s capital spending of USD 51.4 billion left its free cash flow at minus USD 9.1 billion. Alphabet, Amazon, Meta, Microsoft and Oracle have issued USD 271 billion of debt this year, with AI-related debt issuance across global credit markets estimated at USD 657 billion.
Off-balance-sheet commitments add to the total. The same companies carry an estimated USD 1.7 trillion of lease commitments, 75% of which have yet to commence. Rating agencies have become more cautious, with some outlooks lowered, although these companies’ credit ratings start from a high level. Evidence of AI monetisation by 2028 is likely to determine how much more debt the build-out needs.
Q3: Is demand for AI still growing?
Google Cloud revenue grew 103% in the third quarter, Microsoft’s Azure grew 48% and Amazon Web Services grew 39%, with a backlog of USD 578 billion and capacity largely sold out for two years. SK Hynix said its memory chips are effectively sold out until 2029. Anthropic’s listing filing showed revenue of USD 16.3 billion in the first half of 2026, against USD 1.2 billion a year earlier, and an operating profit of USD 974 million in the second quarter.
While it is evident that there is still tremendous demand for AI, the concern largely lies in the pace of growth and the fixed costs behind the growth. Consensus forecasts hyperscaler capital spending of USD 808 billion this year, up 96%, rising to USD 1,163 billion in 2027 (up 44%) and USD 1,289 billion in 2028 (up 11%). Earnings of AI infrastructure companies in the S&P 500 are growing about 80% in the third quarter, against 15% for the rest of the index, and consensus has this slowing to 40% by late 2027. The pace of growth is clearly expected to slow. In addition, while readily available free cash flow and financing have contributed to rapid growth in earnings over the past year, wider credit spreads and weaker equity prices in the second half of 2026 are likely to become a drag in the opposite direction.
Q4: How many more hikes should we expect from the Fed?
The Fed’s October statement noted that “the accumulation of more information” will help the Committee determine its policy stance. Chair Warsh described tighter financial conditions as the “medicine starting to work”, and said neither he nor most participants see the economy running too hot.
A widely expected hike on 9 December would take the funds rate to 4.00-4.25%. At the end of October, markets were pricing in only two additional hikes including December’s, with the funds rate peaking near 4.5% in late 2027. Oil prices remain the main risk to a short hiking cycle, and a third strong monthly core inflation print or a prolonged rise in oil prices could bring a further hike in March.
Q5: What does this mean for my portfolio?
While volatility in the AI space is concerning and has the potential to disrupt markets, our diversified portfolios spread exposure across a wider range of companies, and their value and small cap tilts hold less of the largest growth companies than market-cap indices. With yields now at more attractive levels, a bond allocation that earns higher income returns and will provide ballast for the portfolios during difficult conditions for equities. Staying invested and grounded through periods of volatility and exuberance remains the basis of our approach.
Looking Forward to November 2026
Democrats won majorities in both the House and the Senate in the 3 November midterm elections, by larger margins than expected, flipping seven Republican-held Senate seats and winning a House majority estimated at around 255 seats.
In the trading sessions immediately following the election, it appears that the market has perceived the result as a reduction in policy risk around oil, tariffs and government spending. On 4 November, the Dow Jones Industrial Average rose 3.03%, while the S&P 500 and the Russell 2000 each rose 1.58% and the Nasdaq Composite rose 1.44%. Brent fell about USD 10 a barrel to below USD 100. The 10-year Treasury yield fell to just under 4.9%.
Initial expectations are for Democrats to use various avenues to seek limits on the war with Iran, rollbacks of selected tariffs and a reversal of last year’s spending cuts, which research houses estimate would add 0.25% of GDP to spending in 2027.
The election aftermath for the AI trade has been less promising. Shares associated with data centre build-outs fell sharply as the blue wave swept through states which accounted for a large portion of expected infrastructure development. Democratic governors elected in Texas, Georgia and Michigan campaigned on stricter data centre rules. Analysts expected conditional moratoria in states that account for roughly 45% of planned US data centre capacity, with Texas alone accounting for 25%. These declines have since swept through tech-heavy Asian markets in Taiwan, Korea and Japan.
Events in October and early November once again highlight the importance of staying invested through globally diversified portfolios. In recent months, inter-sector moves have been extreme. Indeed, the sharp sell-off in tech was well matched by an equally sharp rise in typically quiet defensive shares which had largely lagged the market all through 2026. As the market continues to come to terms with rapid developments in the AI landscape, as well as digest strong gains over the past three years, this perilous cycle of musical chairs may well persist through into the new year. Fortunately, investors in our diversified and factor-tilted portfolios have experienced a relatively more comfortable ride in 2026.
With a comprehensive plan already in place with your Client Adviser, covering near-term spending needs while allocating capital at a level of risk suitable for your longer-term goals, you can have the peace of mind to stay invested for the long term, allowing your wealth to compound and fulfil your ikigai. If you have any questions, please do not hesitate to reach out to your Client Adviser.
The writer of this market review, Glenn Tan, is Senior Portfolio Manager at Providend Ltd, Southeast Asia’s first fee-only comprehensive wealth advisory firm. He is also a CFA Charterholder and a Certified Financial Risk Manager (FRM).
For more related resources, check out:
1. Active Investing That Adds Value to the Client
2. Staying the Course: Investing With Confidence in Uncertain Times
3. Here’s Why We Charge a Higher Fee Than Robos
Download our Investment eBook titled “A More Reliable Way to Get Enough Investment Returns: Even During Times of Market Uncertainty” here.
With a minefield of financial misinformation out there, we promise to be a safe pair of hands and a second pair of eyes to help you avoid costly financial mistakes. Learn more about our investment philosophy here.
We do not charge a fee at the first consultation meeting. If you would like an honest second opinion on your current estate plan, investment portfolio, financial and/or retirement plan, make an appointment with us today.