Executive Summary
Equities continued their upward trend in March. However, this time, value stocks shone. Strong performances from the energy, material, industrial, and financial sectors boosted equities.
As we transition into Q2, it’s time to review the impressive performance of Q1, largely driven by optimism surrounding artificial intelligence. However, it is important to remain cautious as the path ahead may still be uncertain, with the Federal Reserve closely monitoring inflation data to guide interest rate decisions.
In this month’s market review, we delve into the landscape of Japan’s equity market as part of a series covering major economies’ markets for the next few months.
Despite struggling with decades of deflationary pressures and economic stagnation, Japan appears to be seeing signs of improvement as inflation begins to rise. While this inflation presents challenges, there are indications that the potential benefits outweigh the risks. With Japanese households holding significant savings of 7 trillion USD, there is a growing possibility that they may turn to equities as expectations of rising inflation prompt them to seek alternatives to maintain the purchasing power of their wealth.
Japan represents the second-largest country exposure in the global equity stock market, as represented in the MSCI All Country World Index, as well as for Providend. Therefore, we are well-positioned to capitalise on any emerging opportunities in Japan.
March Performance
Stocks delivered robust performance in March, with the MSCI World index, the MSCI All Country World index, and the S&P 500 index all rising by 3.2%. This rise is attributed to the Federal Reserve’s decision to maintain its projection of three rate cuts, which could lead to borrowing costs decreasing sooner than expected, especially with inflation rising over the past two months. This could lower yields, helping companies in need of funds and lifting the stock market.
Moreover, semiconductor companies in both developed and emerging markets saw a surge in their stock prices in March, driven by optimistic prospects for AI technology. Notable examples include Nvidia and Broadcom in the US, which rose by 14% and 2% respectively, ASML in Europe with a 2% increase, and Tokyo Electron in Japan experiencing a 7.3% gain. In emerging markets, Samsung Electronics and SK Hynix recorded increases of 12% and 17% respectively, while Taiwan’s TSMC saw a 13% rise.
However, the IT sector, especially big tech, did not play a major role in March’s performance. Tesla, for example, saw its stock price drop by over 10% due to disappointing sales. Instead, sectors like Energy, Materials, Industrials, and Financials drove the stock market. Interestingly, these sectors align with where value stocks are concentrated, which Dimensional equity funds are overweighted in. As a result, Dimensional funds performed better than the indexes in March, suggesting that value stocks outperformed growth stocks.
To illustrate how each sector performed in March, we use the US stock market as a proxy, representing about 70% of country weights in the MSCI World Index. This analysis will be shown in two exhibits: Exhibit 1 and 2.
Exhibit 1 compares sector weights and performances of the Global Core Equity, the MSCI World, and the S&P 500. For example, the IT sector of the S&P 500 increased by 0.62% in March. The Global Core Equity’s overweight positions in Energy, Materials, and Industrials, which rose by 9.60%, 6.09%, and 4.10% respectively, contributed to its outperformance against the MSCI World index.
Exhibit 1 – Dimensional Global Core Equity vs MSCI World Sector Weight and S&P 500 Sector Performance March Month-To-Date (MTD)
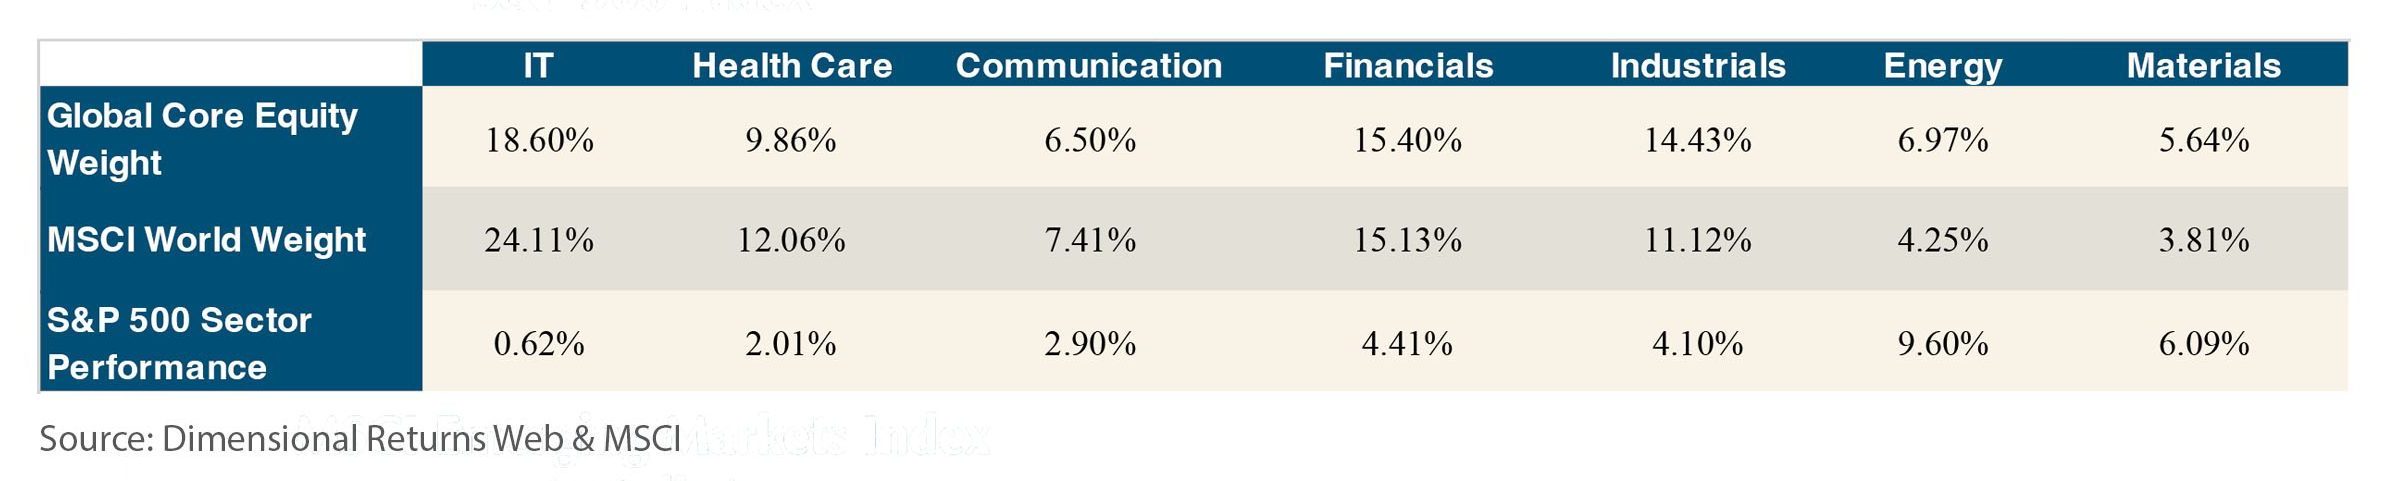
*Please be aware that the total sector weights do not sum up to 100%. This discrepancy arises because certain sectors are excluded from the calculation. These sectors are omitted due to their comparatively minimal influence. For instance, utilities exhibit a sector weight of only 2-2.5% in the Global Core Equity and the MSCI World index.
Although the S&P 500 reflects the top 500 US companies, it is wise to also consider the Russell 1000 and the Russell 2000 indexes. These indexes provide a broader perspective on the US stock market and will offer more certainty if value stocks outperform growth stocks in the US for the month.
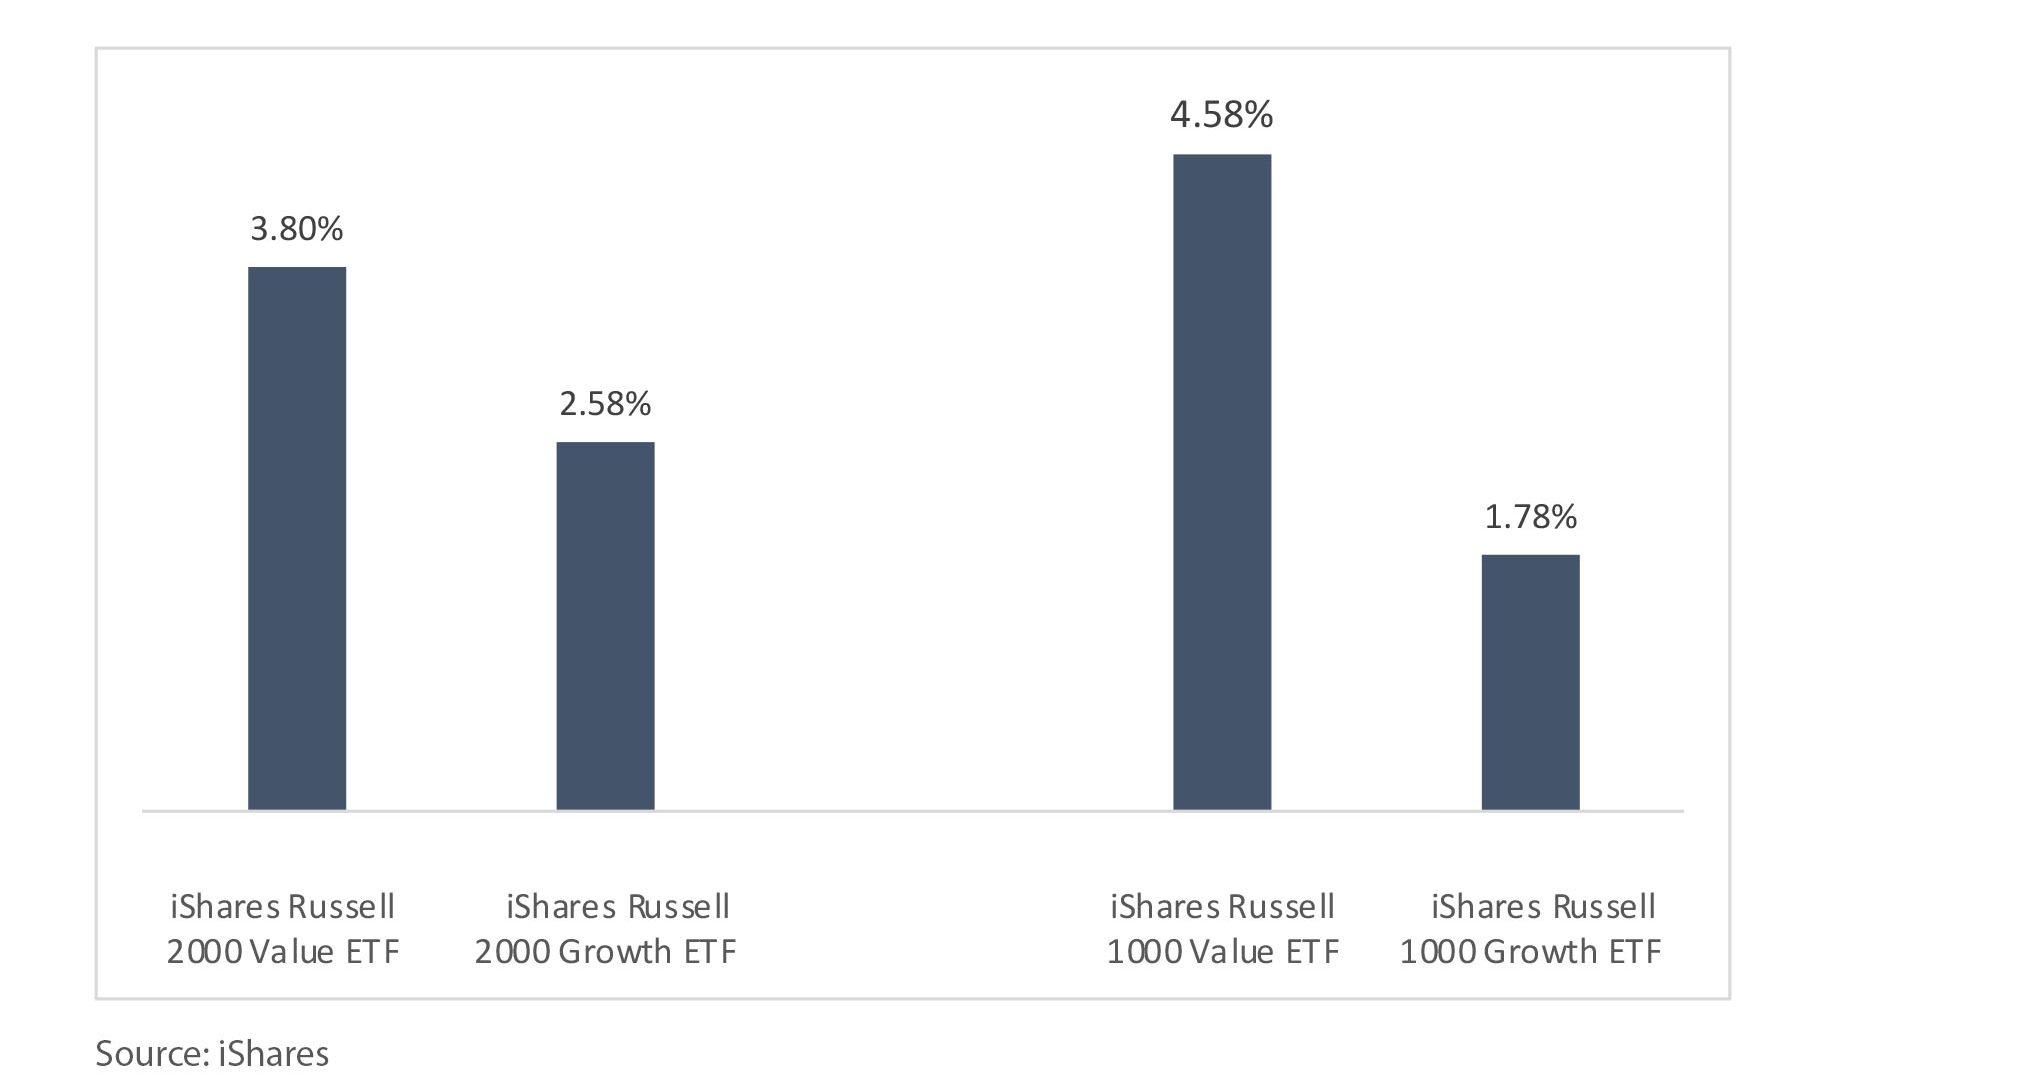
Exhibit 2 shows a chart comparing the performance of value and growth stocks within the top 1000 and bottom 2000 US-listed stocks. It uses the iShares Russell 1000 Value and Growth ETFs for the top 1000 stocks and the iShares Russell 2000 Value and Growth ETFs for the bottom 2000 stocks, which track the Russell 1000 and the Russell 2000 value and growth indexes, respectively. Consistently, in both ETFs, value stocks outperformed growth stocks in March.
Exhibit 2 – iShares Russell 2000 ETFs and iShares Russell 1000 ETFs (Value vs Growth) March MTD
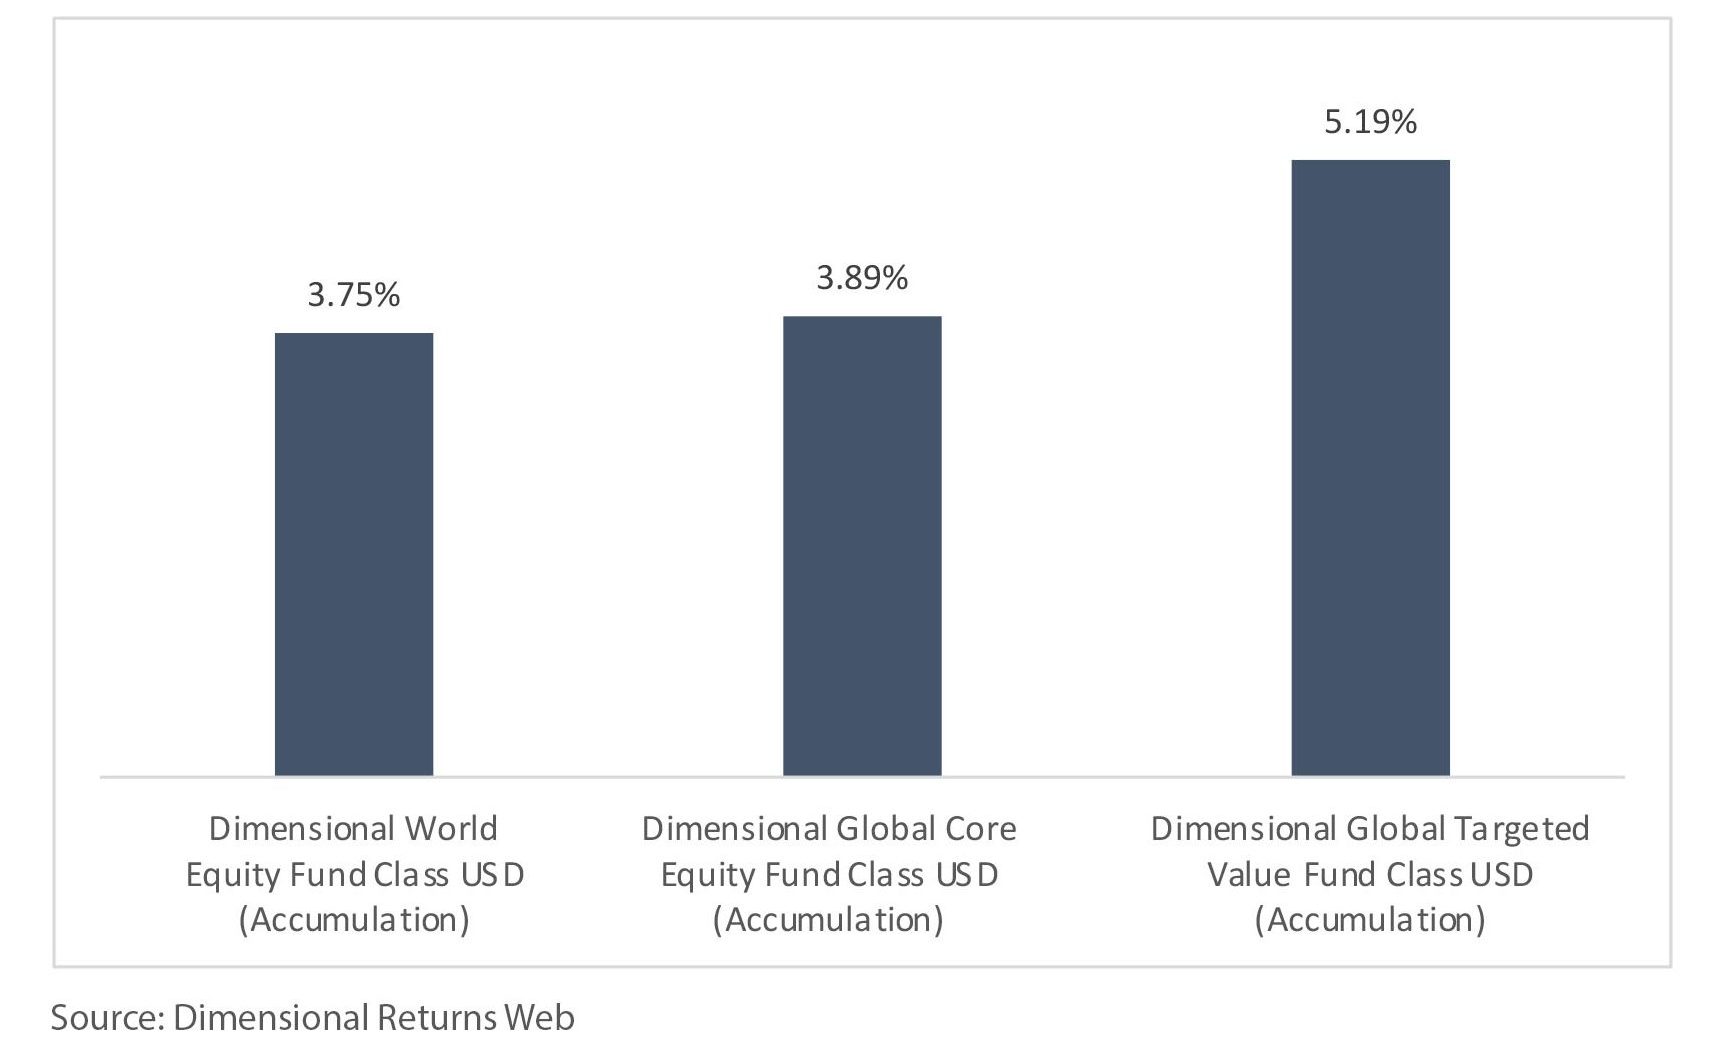
As a result, Dimensional’s equity funds, with their emphasis on value, showcased impressive performance in March, as illustrated in Exhibit 3.
In particular, the Global Targeted Value fund jumped by 5.2% last month. This increase was due to its larger allocations to sectors like Energy, Materials, Industrials, and Financials. With a strong focus on value as a core strategy of this fund, it is not surprising that it did well in a month where value stocks performed.
Exhibit 3 – Dimensional Equities Fund MTD March Performance
Quarter 1’s Performance Overview
As March signals the end of the first quarter, let us take a brief look at the overall performance of market indexes and funds during the period.
Market Indexes Q1 Performance
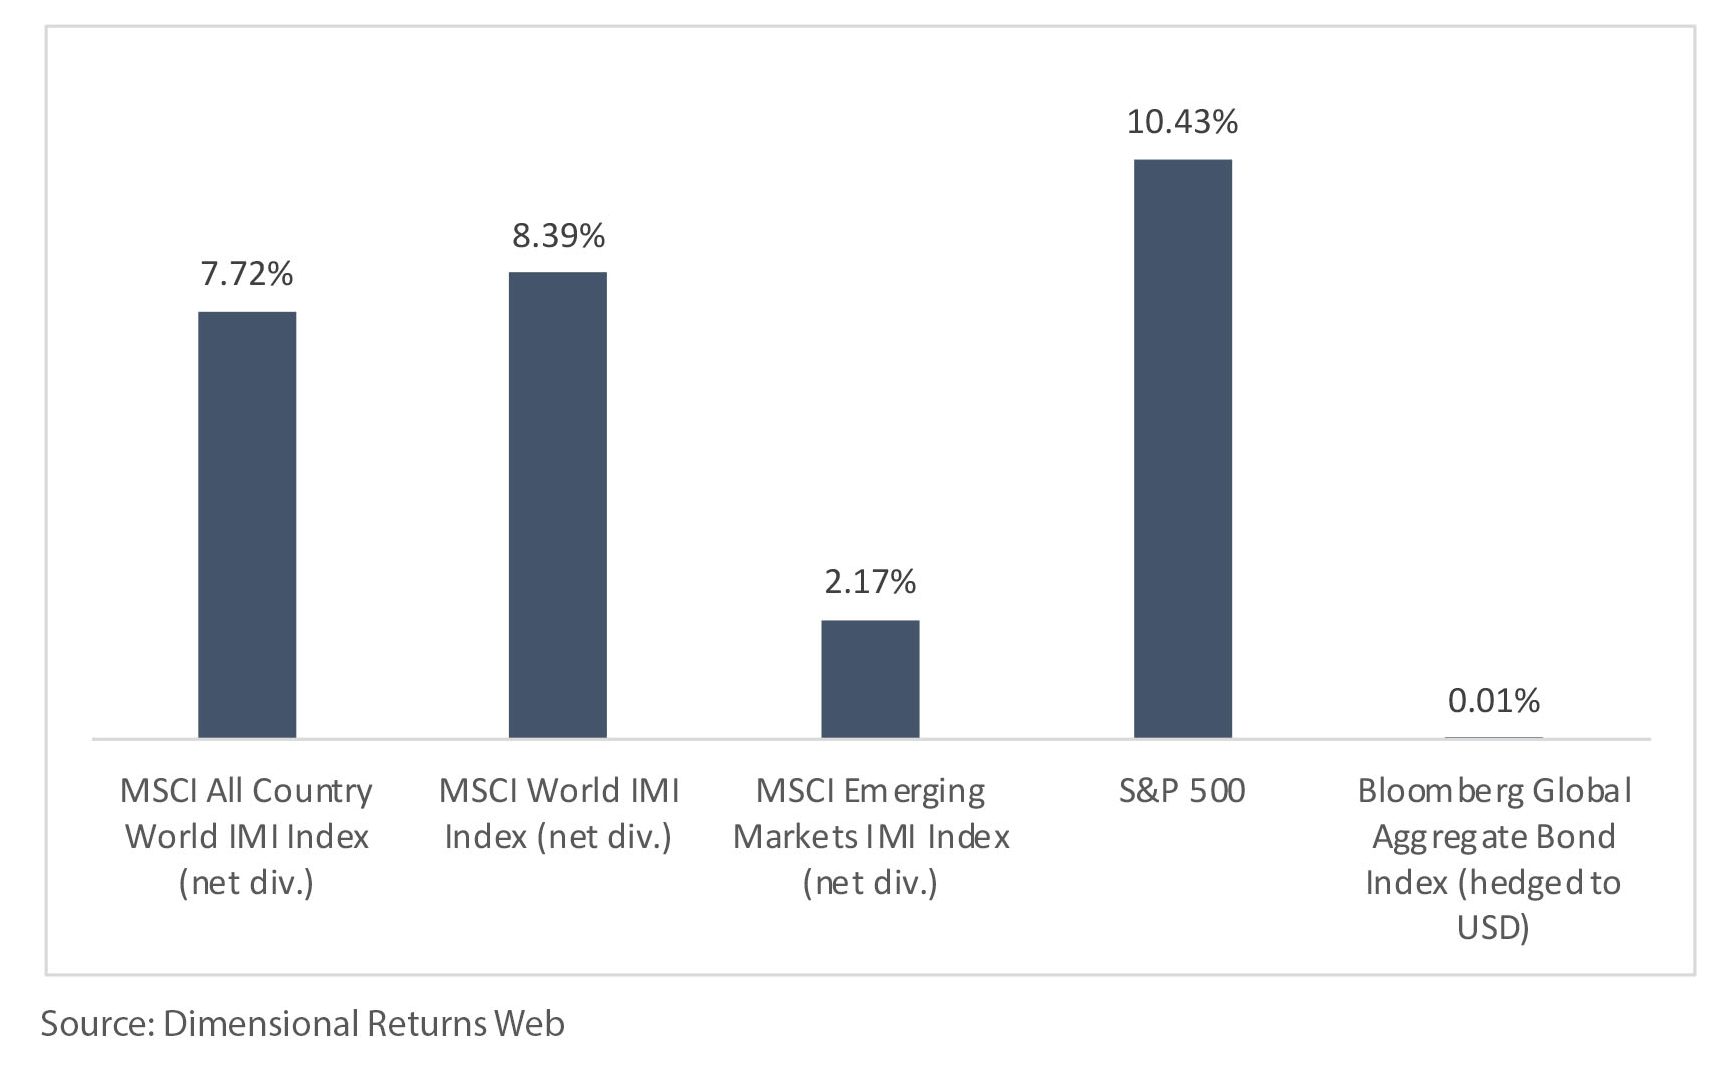
As shown in Exhibit 4, in the stock market, the MSCI All Country World Index IMI went up by 7.72% year-to-date (YTD) by the end of March. The MSCI World IMI index increased by 8.39% YTD by March’s end, while the MSCI Emerging Market IMI saw a YTD rise of 2.17% as of March’s end. Notably, the S&P 500 climbed by 10.43% YTD by the end of March.
Much of the market’s YTD rise is linked to the anticipation of the AI revolution, leading to a surge in revenue or higher revenue projections for US big tech. This explains why the S&P 500 has already seen double-digit growth. However, this does not mean that the rest of the developed market is doing poorly; they just have not performed as well as the US.
The Stoxx Europe 600 and the Nikkei 225 rose by 7.3% and 20% respectively in Q1, reaching record highs.
In Europe, the AI trend boosted the Stoxx 600 tech companies like ASML Semiconductor and SAP Software, which saw rises of 31% and 29% respectively in Q1. Also, Novo Nordisk Pharmaceutical and LVMH, the luxury giant, with weights of 2.4% and 2.2% in the Stoxx Europe 600, increased by 26% and 14% respectively, driven by strong earnings growth.
In Japan, the Nikkei 225 rose, possibly due to strong corporate governance initiatives by the Tokyo Stock Exchange. This might have attracted foreign investment due to optimism about the reforms. In the next section, “Japan’s Equity Landscape,” we will discuss these corporate governance changes as part of our coverage of Japan’s stock market.
In the fixed-income market, the Bloomberg Global Aggregate index had about a 0% return YTD. This happened because although yields rose YTD, the decrease in corporate spreads offset the effect of the higher yields.
Exhibit 4 – Market Indexes YTD Performance as of 31 March 2024
Portfolio Funds Q1 Performance
Now, we turn our attention to the funds used in our portfolios.
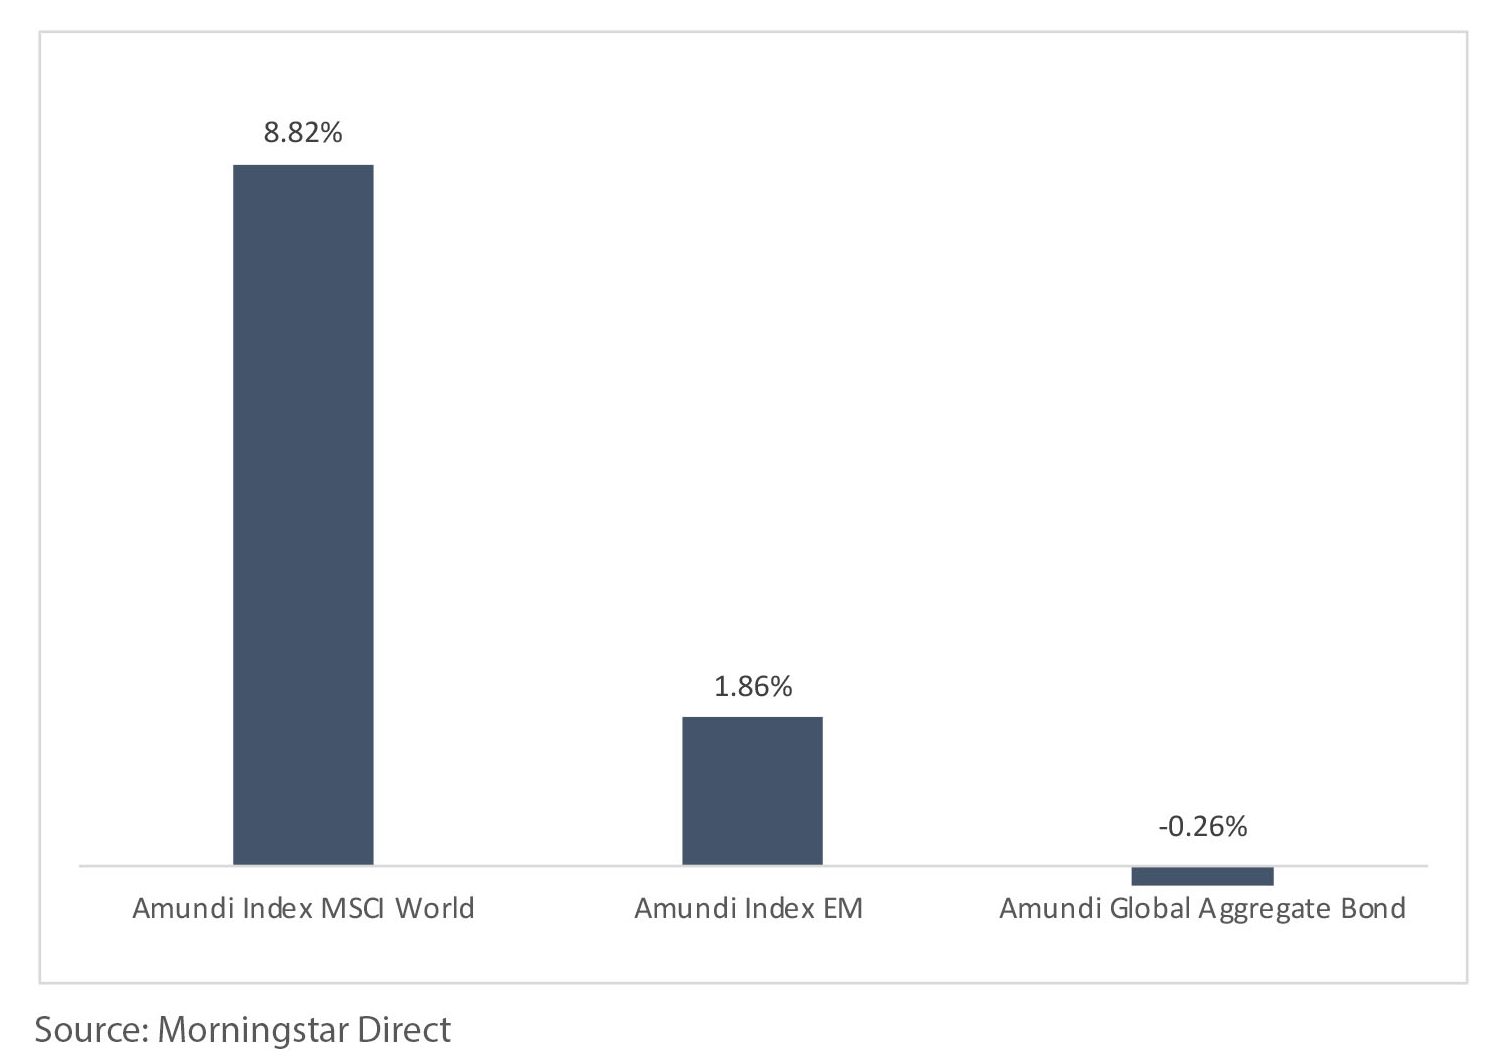
The performance of the Amundi funds aligns closely with the indexes that they track. The YTD performance of the Amundi Index MSCI World, the Amundi Index MSCI EM, and the Amundi Global Aggregate Bond index funds stands at 8.82%, 1.86%, and -0.26% respectively as of the end of March, as illustrated in Exhibit 5.
Exhibit 5 – Amundi Funds YTD Performance as of 31 March 2024
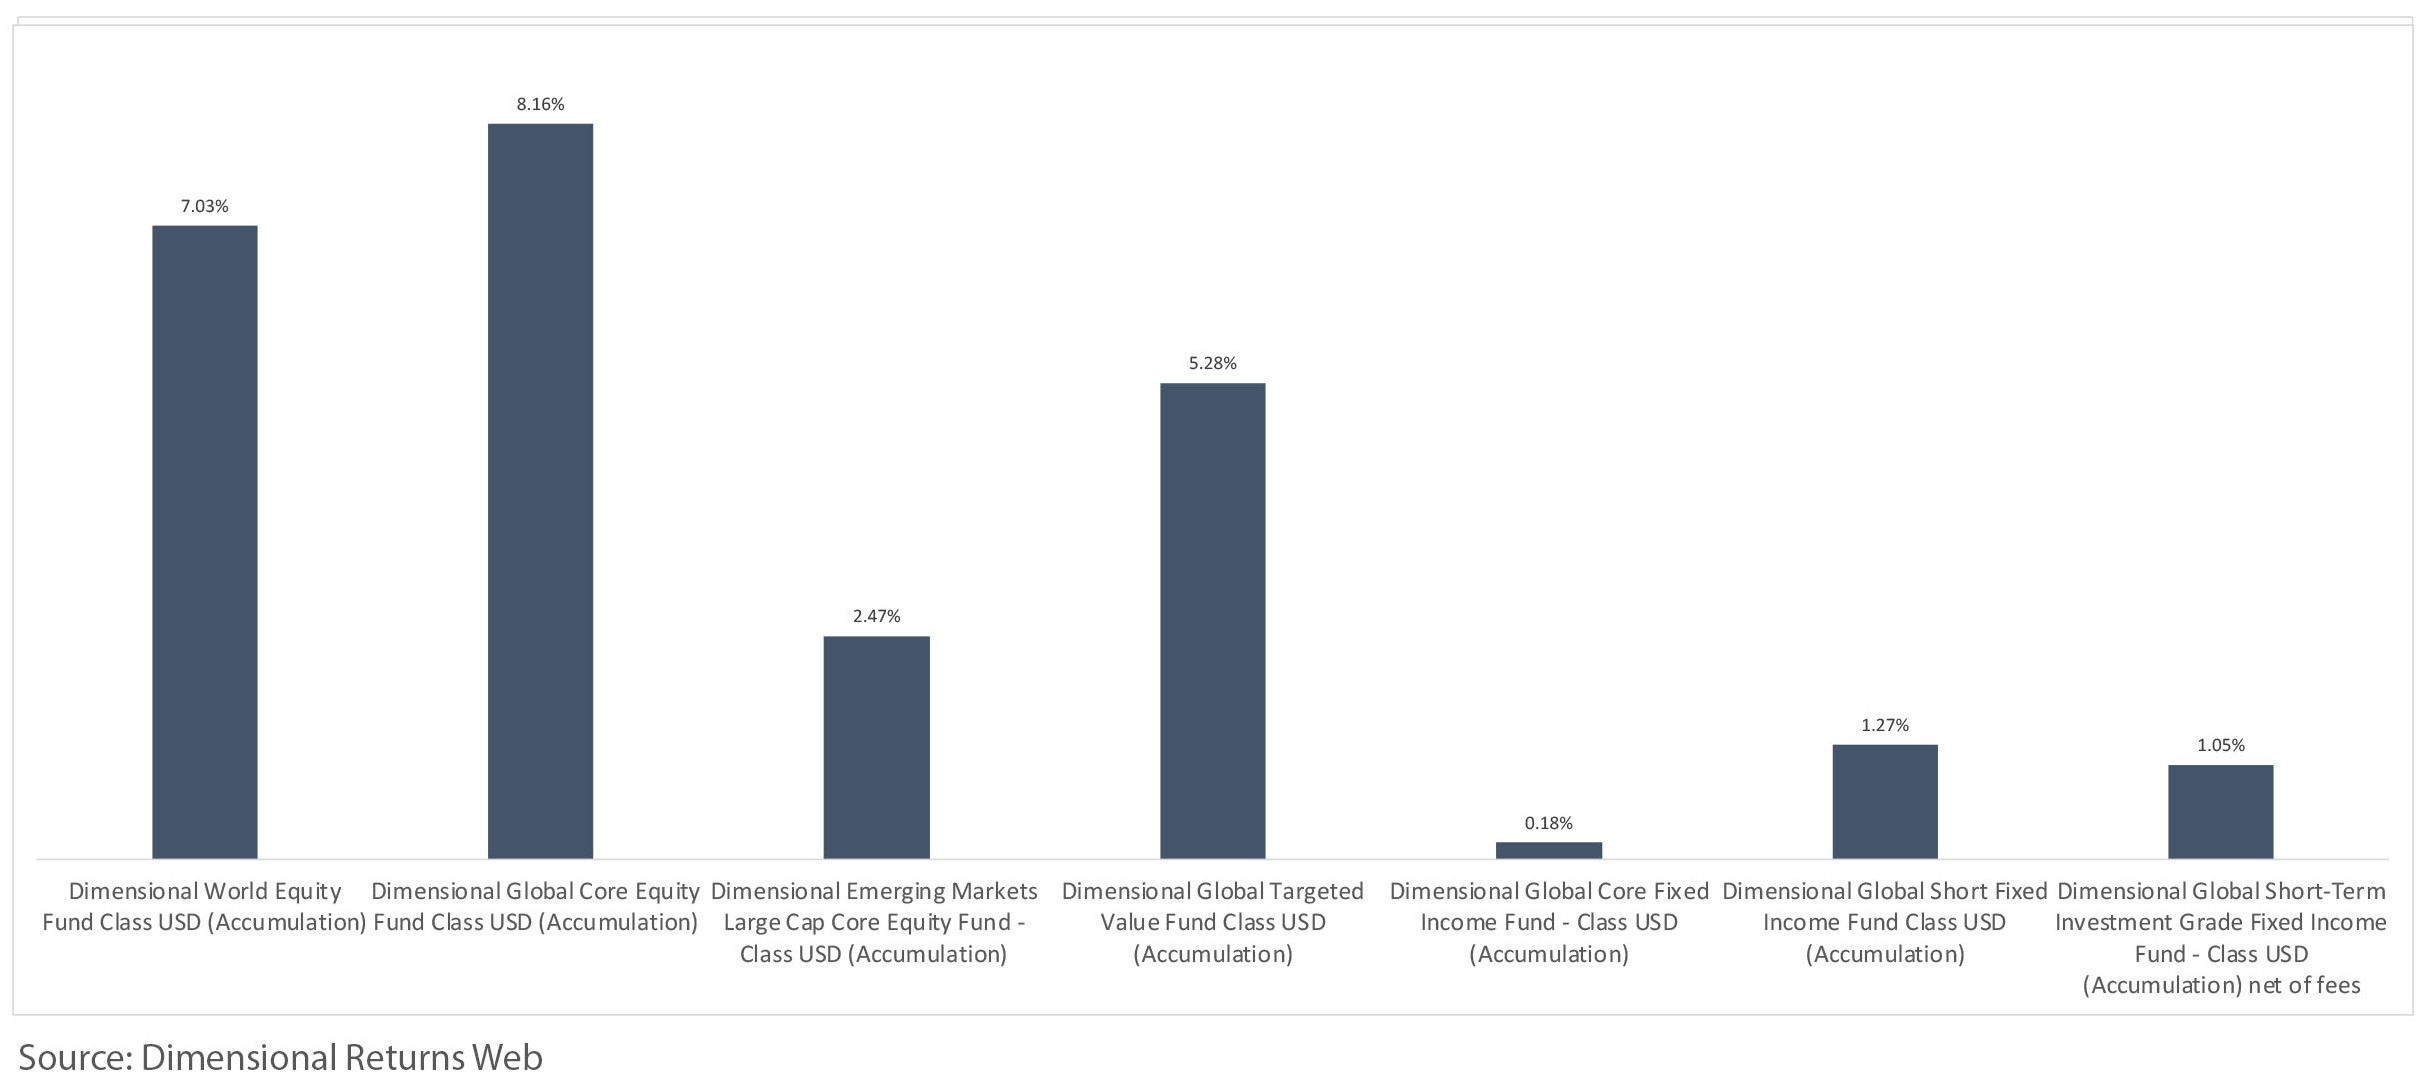
Regarding the Dimensional equity funds, the Dimensional World Equity, the Dimensional Global Core Equity, the Dimensional Large Cap Core EM, and the Dimensional Global Targeted Value funds each rose by 7.03%, 8.16%, 2.47%, and 5.28% respectively in Q1, as of the end of March, as indicated in Exhibit 6.
However, growth-oriented stocks outperformed value stocks during this period, largely due to the significant performance of US big tech companies. For instance, Nvidia saw an increase of 82.5% in Q1, driven by high demand for its AI chips. This affected the performance of the Global Core Equity fund, which underperformed the MSCI World index in Q1 because it holds fewer shares in companies like Nvidia. Nevertheless, despite this, the Global Core Equity fund still achieved a notable return of 8.03% in Q1. This was possible because the fund managed to capture the overall market gains, particularly in developed markets such as the US, Europe, and Japan.
In the fixed income sector, the Amundi Global Aggregate fell by 0.53%, while the Dimensional Global Core Fixed Income, the Global Short Fixed Income, and the Short-term Investment Grade funds increased by 0.18%, 1.27%, and 1.05% respectively in Q1.
The Global Core Fixed Income fund outperformed the Amundi Global Aggregate Bond fund by 0.44% YTD. This highlights the success of Dimensional’s fixed-income investment strategy, which aims to achieve higher expected returns.
Exhibit 6 – Dimensional Funds YTD Performance as of 31 March 2024
While Q1 yielded positive results for equities, it is important to note that the road ahead remains bumpy, as incoming data that sheds light on the US inflation rate continues to dictate whether the Federal Reserve adjusts interest rates upwards or downwards in response to inflation trends to ensure its goal of a 2% inflation rate. Part of the recent rally has been the market pricing in the expectations of rate cuts later in the year, so any change to this outlook will likely cause some re-pricing of financial assets.
In the upcoming section, we will delve into the Japanese equity landscape. This will mark the initial segment of a series covering the equity climates of major economies worldwide in the upcoming monthly market reviews.
Japan Equity Landscape
Given its allocated country weight of around 6% in the MSCI World Index, Japan represents the second-largest single country exposure in global equity stock market indexes. Therefore, it is crucial to grasp the dynamics of Japan’s equity landscape.
Initially, we will explore the YTD performance of Japan’s stock market and the factors influencing it. Subsequently, we will analyse the outlook for Japanese equities and the pivotal driving forces guiding their future path.
Japan’s YTD Performance as of 31 March 2024
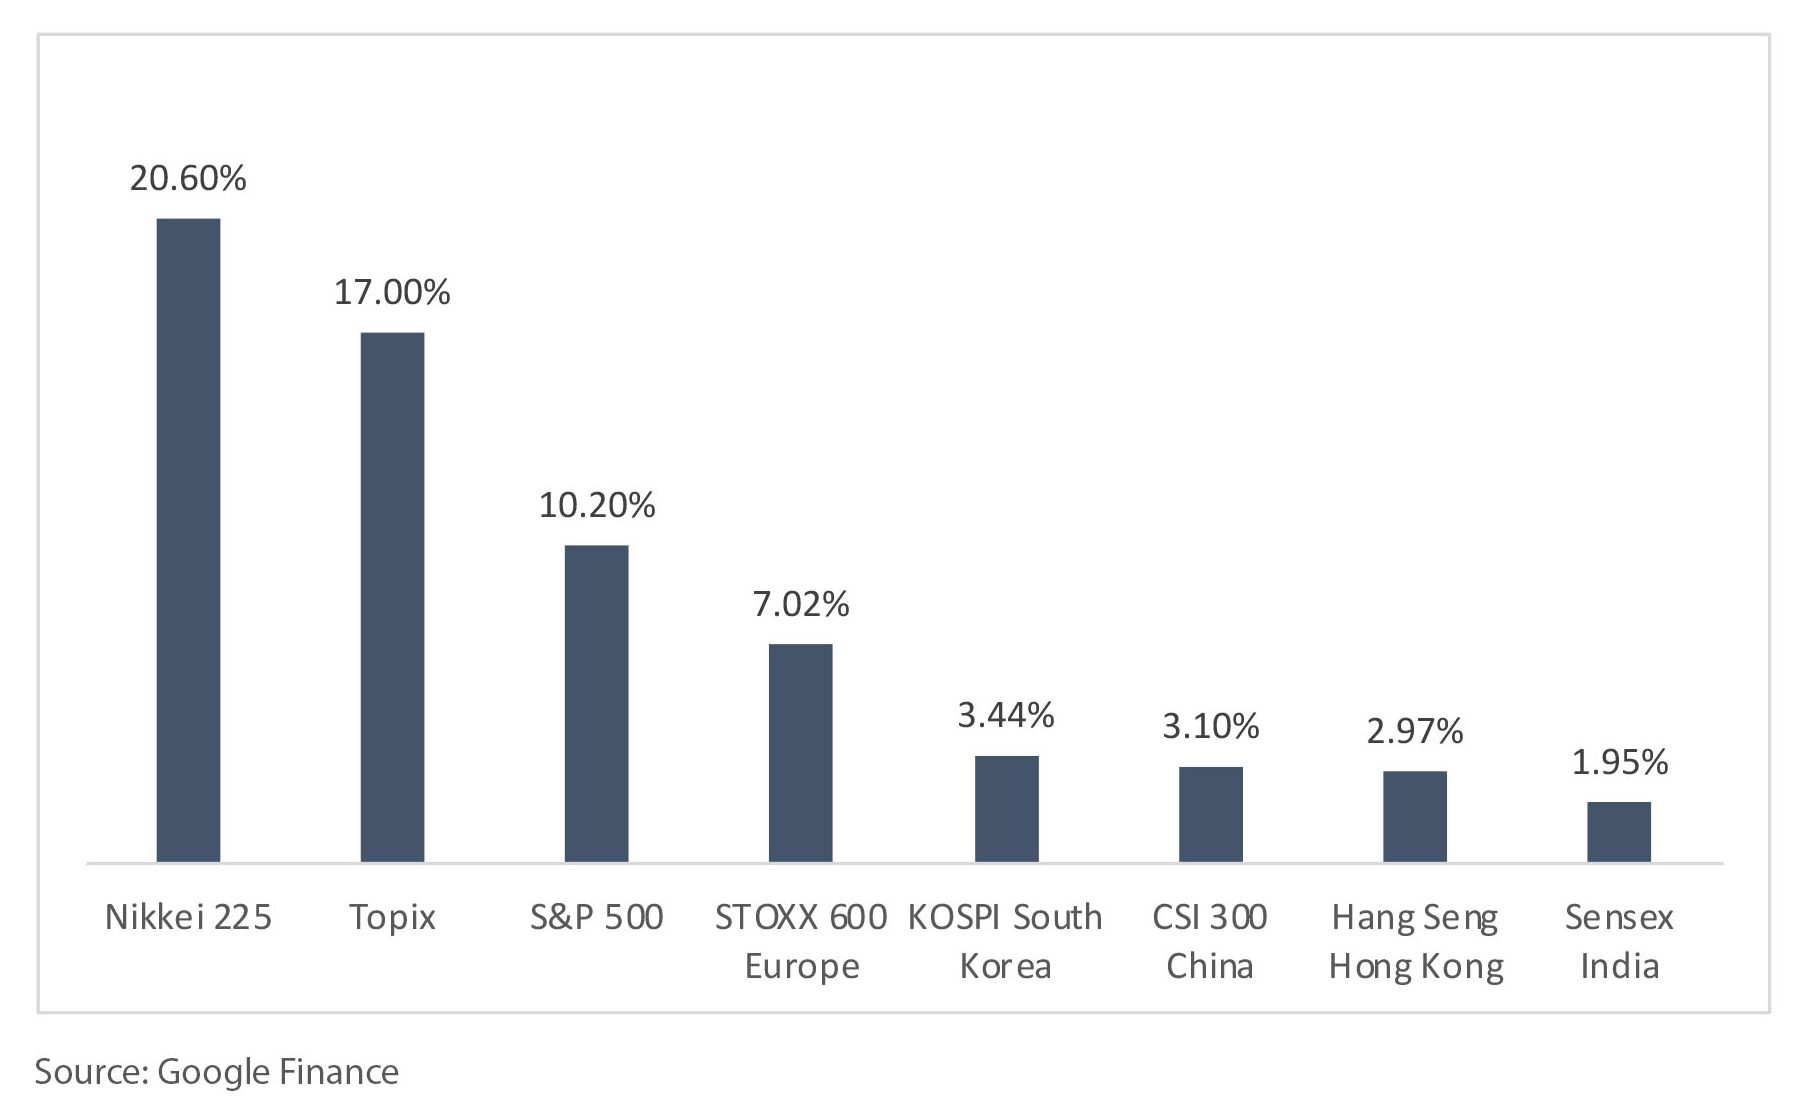
YTD, Japan’s two major indexes, the Topix, a market benchmark with functionality as an investable index, covering an extensive proportion of the Japanese stock market, and the Nikkei 225, which tracks Japan’s top 225 companies on the Tokyo Stock Exchange, have risen 17% and 20% respectively. The Topix and the Nikkei have been the top two performers as opposed to the other major indexes YTD, in their respective domestic currencies as shown in Exhibit 7.
Exhibit 7 – Global Major Indexes YTD Performance as of 31st March 2024 (Domestic Currencies)
What Is Driving Japan’s Strong Stock Market Performance?
First, Japan’s corporate earnings have been impressive. Tokyo Electron, Japan’s largest semiconductor company, and Toyota Motor have reported expectation-beating earnings and have so far risen more than 60% and 30% respectively, in yen terms. Part of the contribution is likely due to the depreciating yen that increases the profits of exporting companies. According to Bloomberg, net income at the Topix 500 companies rose 46% from a year earlier to a record ¥13.9 trillion ($93 billion) in the October-December quarter.
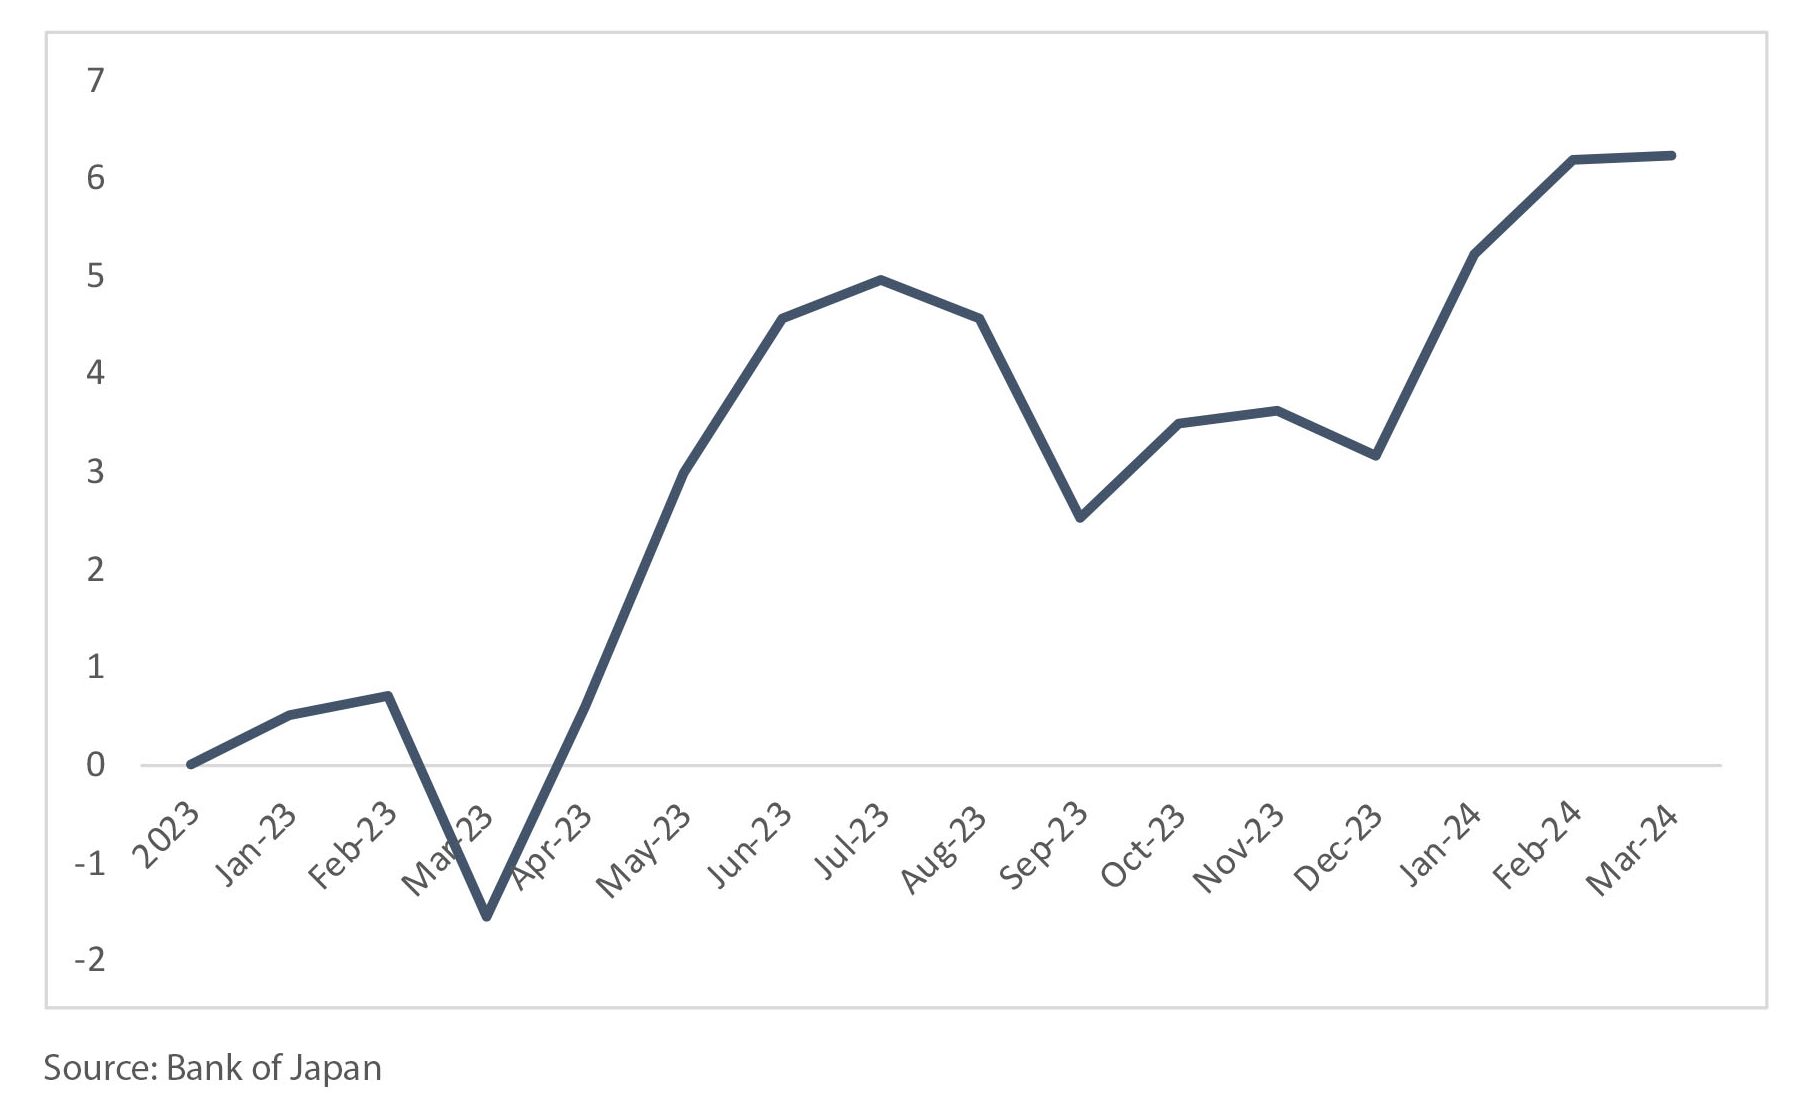
Secondly, the influx of foreign investor flows has been increasing since the start of 2023, and the increase has been especially pronounced since the start of 2024 when foreign investors increased their investments into Japanese equities by more than 3 trillion yen, as shown in Exhibit 8. The influx of foreign funds could be due to the increased geo-political risks in China that have driven investors to reallocate their funds to Japan.
Thirdly, Japan’s proactive efforts to adopt a more shareholder-friendly approach and enhance shareholder value may have played a role in the increase of foreign fund inflows. Both the Japanese Financial Services Agency (FSA) and the Tokyo Stock Exchange (TSE) have introduced substantial reforms to strengthen corporate governance and improve capital efficiency to enhance shareholder value. For example, last year, the Tokyo Stock Exchange required all listed companies to implement policies aimed at improving profitability, long-term returns, and valuations. Failure to meet these listing standards could potentially result in these companies being delisted from the index.
In conclusion, Japan’s stock market rise this year could likely be attributed to strong corporate earnings, increased foreign investments due to geopolitical tensions with China, and proactive reforms enhancing shareholder value.
Exhibit 8 – Cumulative Flow of Foreign Investors Funds Into Japanese Equities Since January 2023 – March 2024 (Trillions of Yens)
Japan’s Stock Market Outlook
The increasing inflation rate in Japan brings both challenges and opportunities for the Japanese stock market. Yet, the overall outlook leans toward optimism rather than pessimism. Next, let us delve into the reasons behind this positive sentiment.
Challenges: Japan’s Welcoming Inflation? Not Really
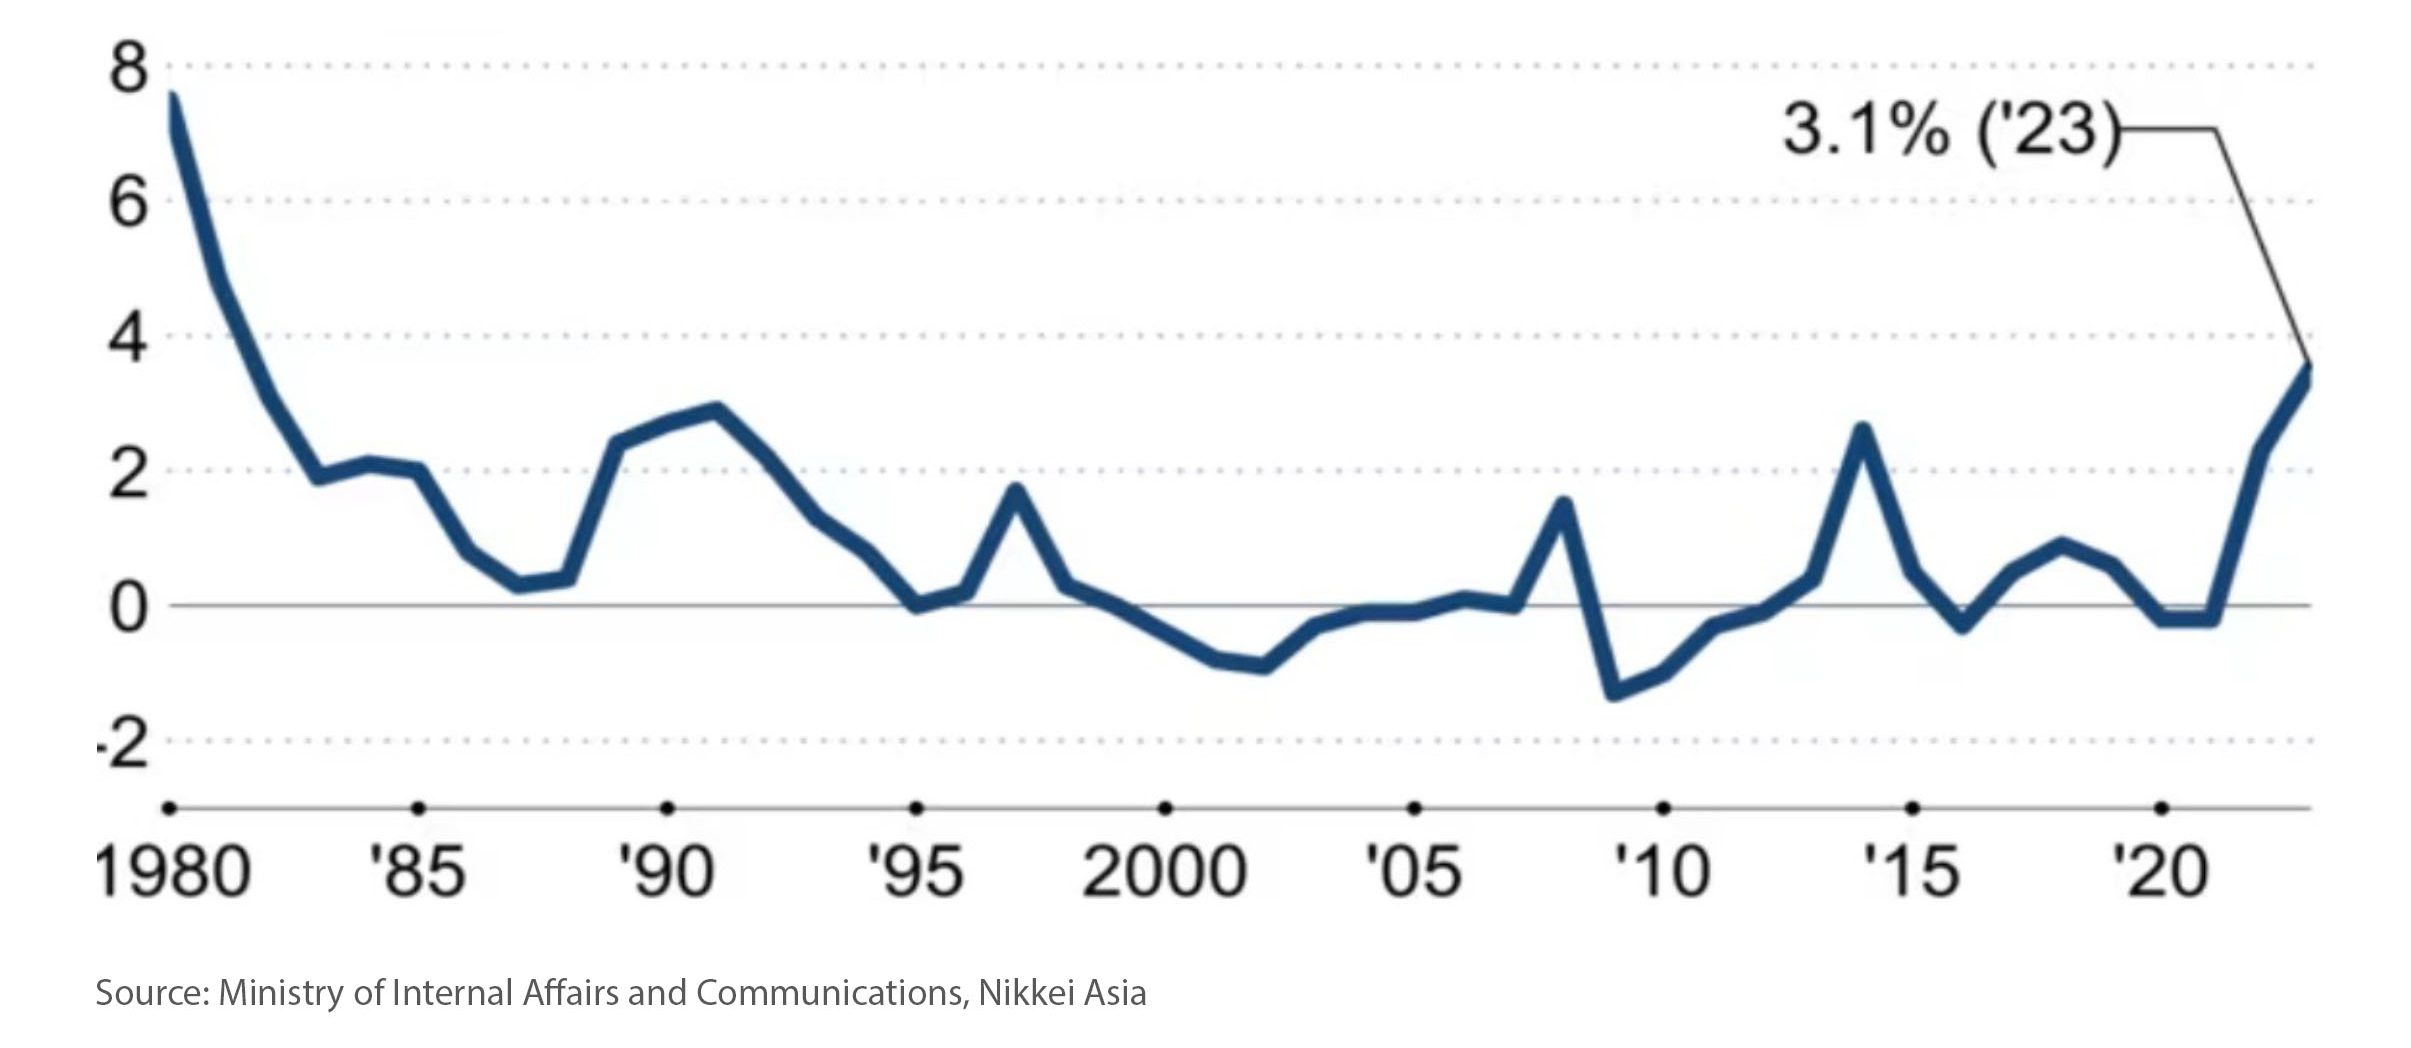
To provide context regarding the headline’s question and answer, Japan has faced persistent deflationary challenges for decades. This has led to stagnant economic growth and lacklustre performance in the stock market. However, there has been some alleviation in recent years, with core inflation reaching 3.1% last year, its most substantial rise since 1982, as demonstrated in Exhibit 9.
Exhibit 9 – Japan’s Core Inflation Rate 1980 – 2023 (Yearly Average, in Percent)
However, the rising inflation rate may not be entirely beneficial. This is because the increasing prices are not driven by a rise in consumer demand, which the Japanese government and central bank have been expecting as it would substantially boost Japan’s GDP. Instead, the inflation is fuelled by rising input costs.
To expand on the point mentioned earlier, Exhibit 10 demonstrates that Japan’s consumption activity has shown little change over the last two decades, consistently staying close to the 100 mark, suggesting minimal growth.
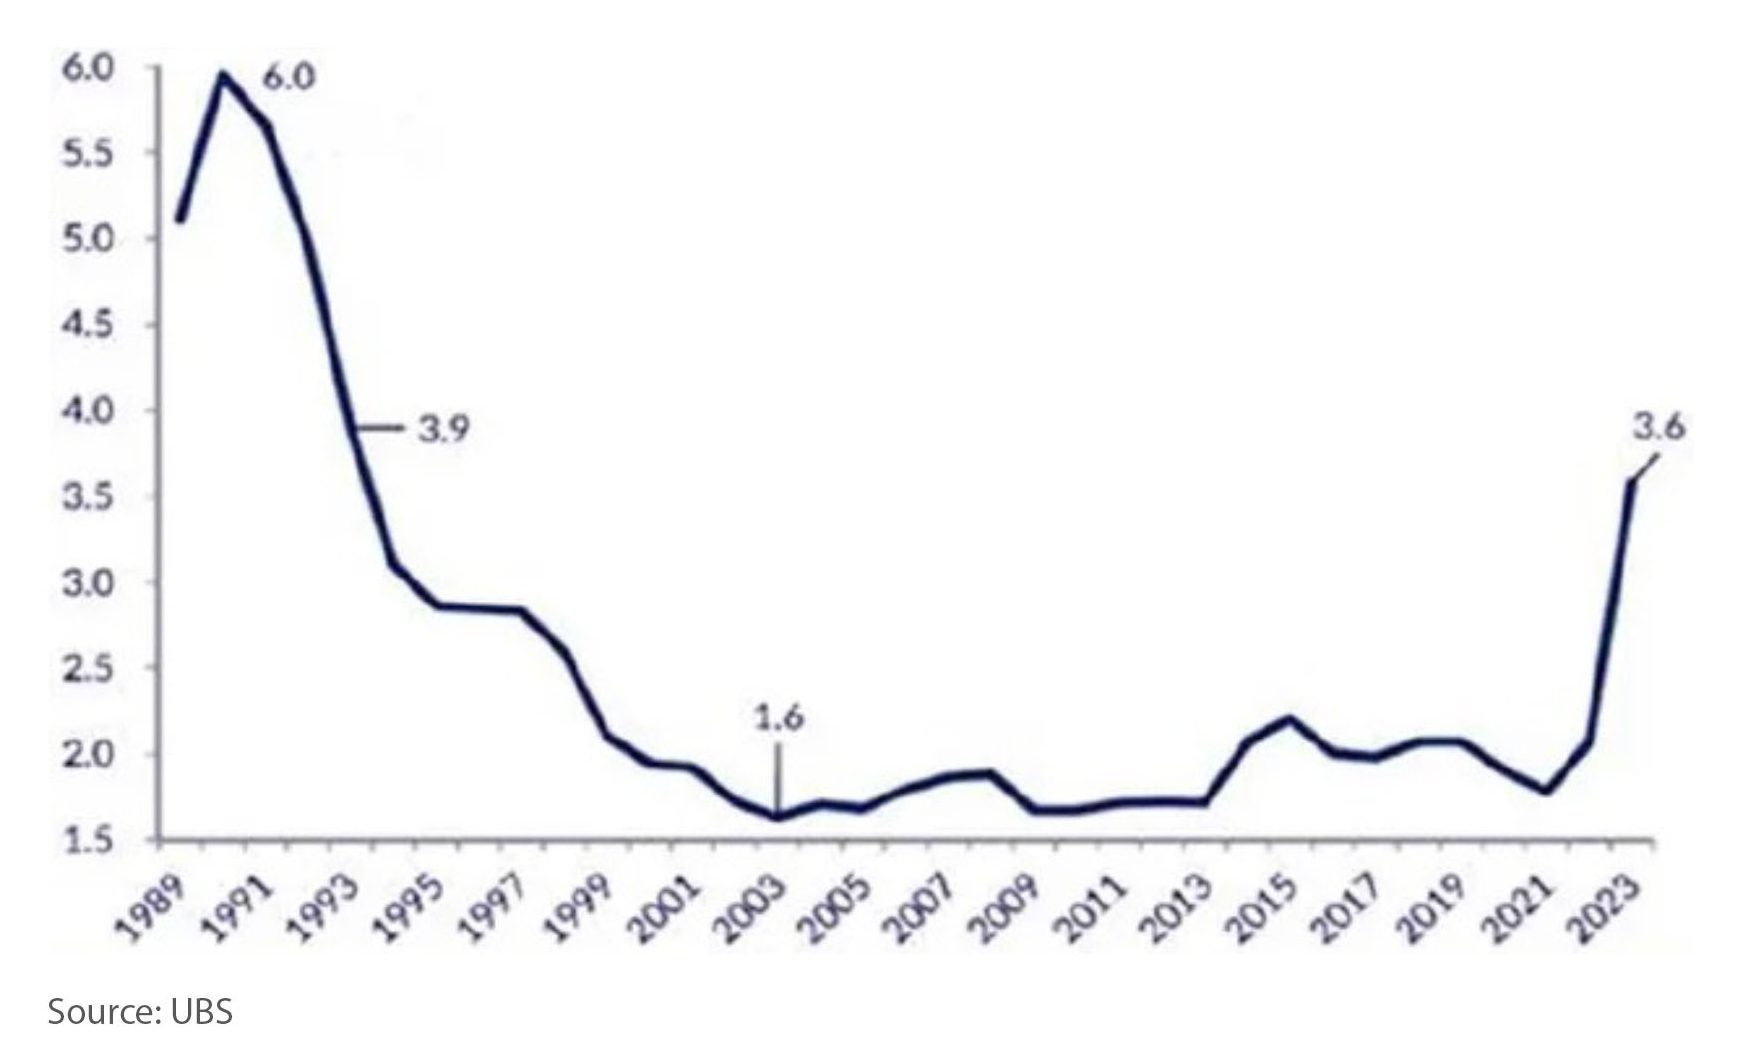
Certainly, it seems improbable that consumption activity would undergo significant growth given the subdued nature of wage growth in Japan, which has fluctuated between 1% to 2% levels from the 2000s until 2022, as demonstrated in Exhibit 11.
Rather, the rise in inflation is caused by higher input costs. This is because of low-interest rates in Japan and higher rates in other countries in recent years, which has led to a weaker yen and increased costs for imported food. Additionally, the Russian invasion of Ukraine has raised oil prices, adding to Japan’s inflation, a country that relies heavily on oil imports.
Exhibit 10 – Japan’s Consumption Activity Index (Above 100 = Increase in Consumption, Below 100 = Decrease in Consumption)
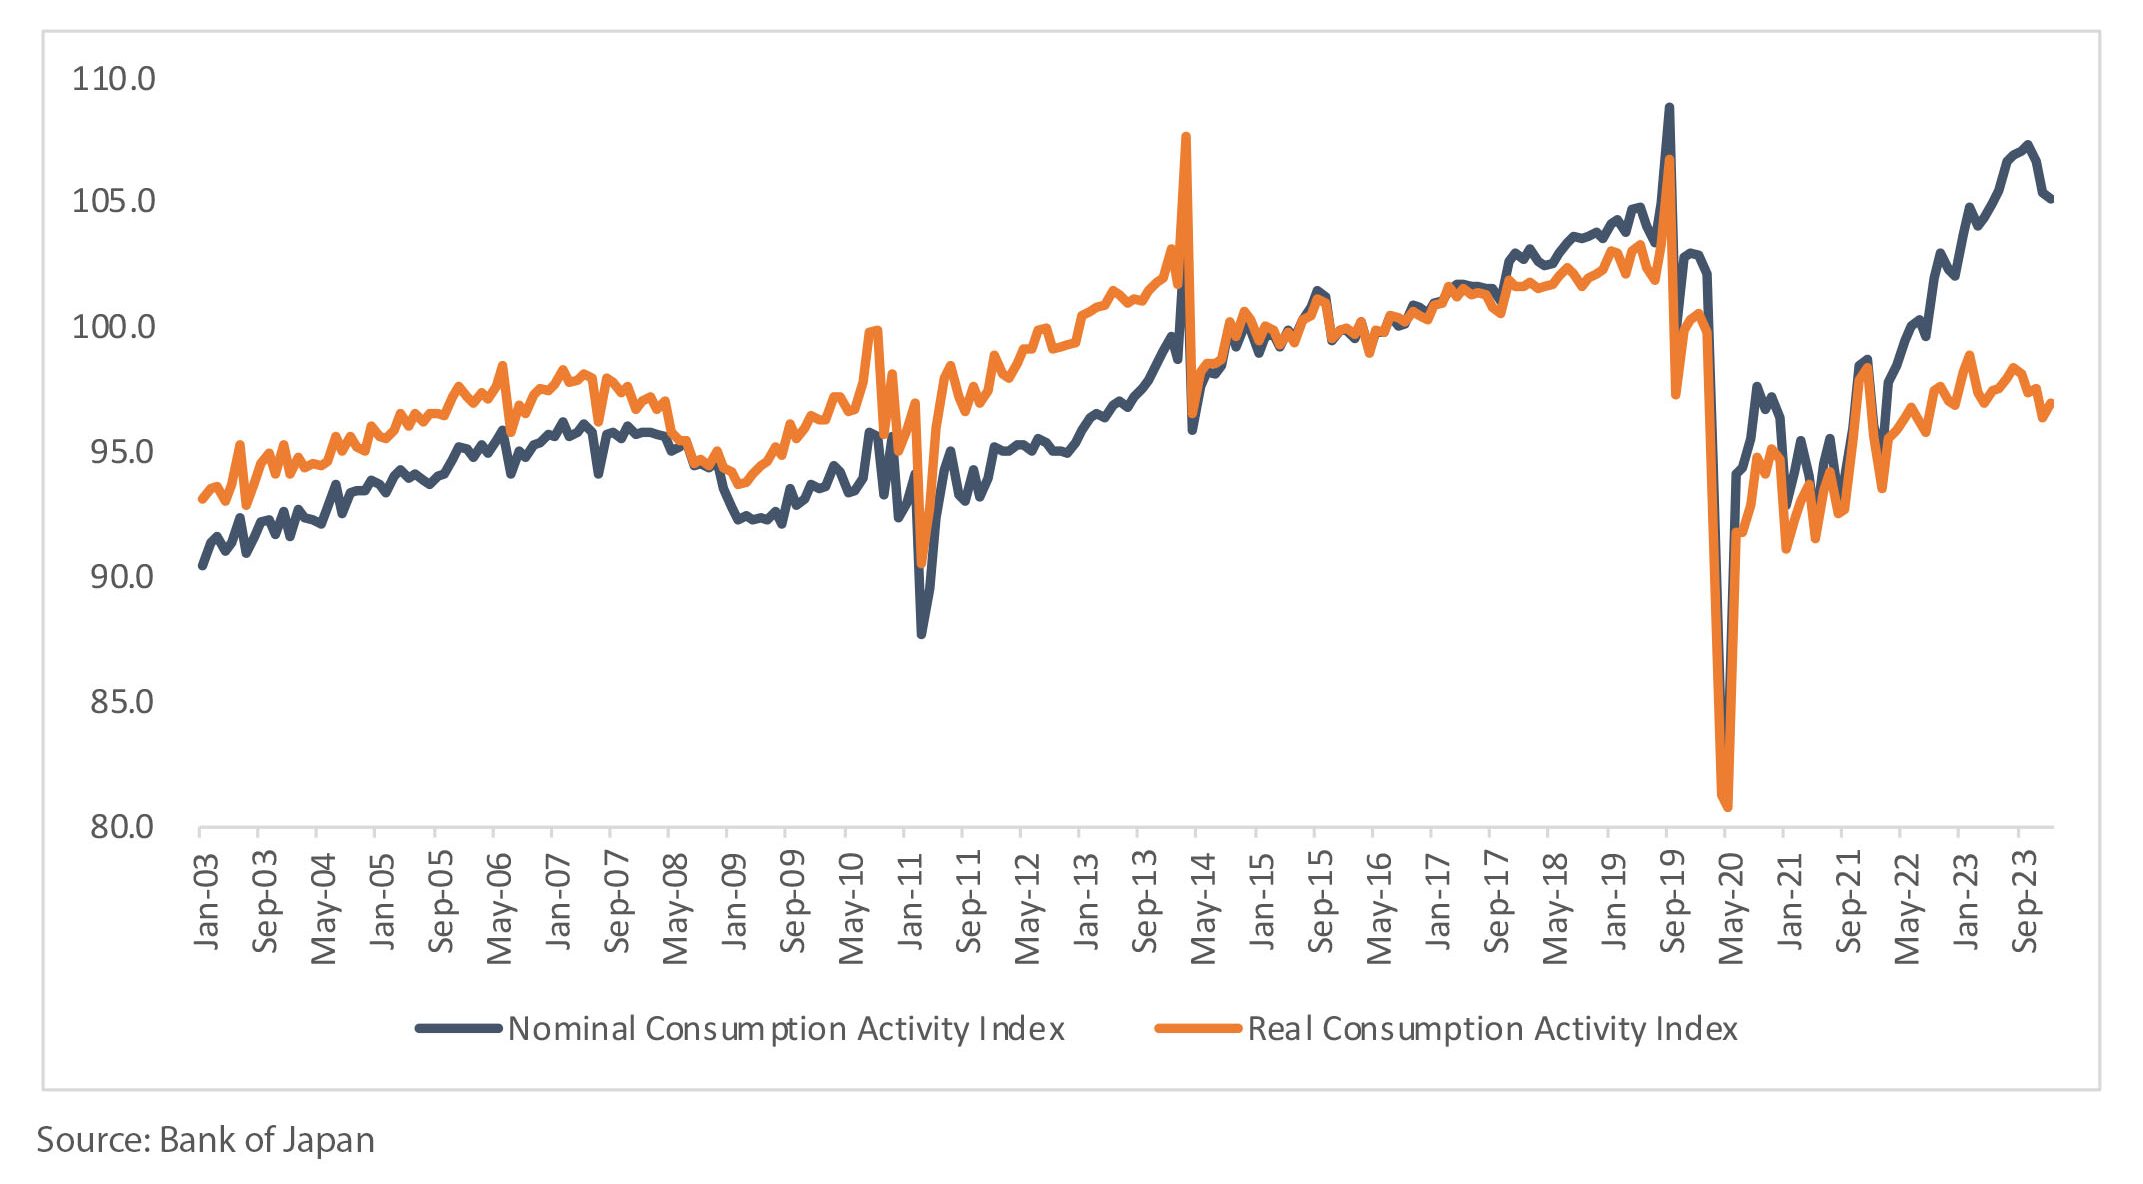
*Real Consumption Activity accounts for inflation.
Exhibit 11 – Japan Wages YoY Change 1989 – 2023 (%)
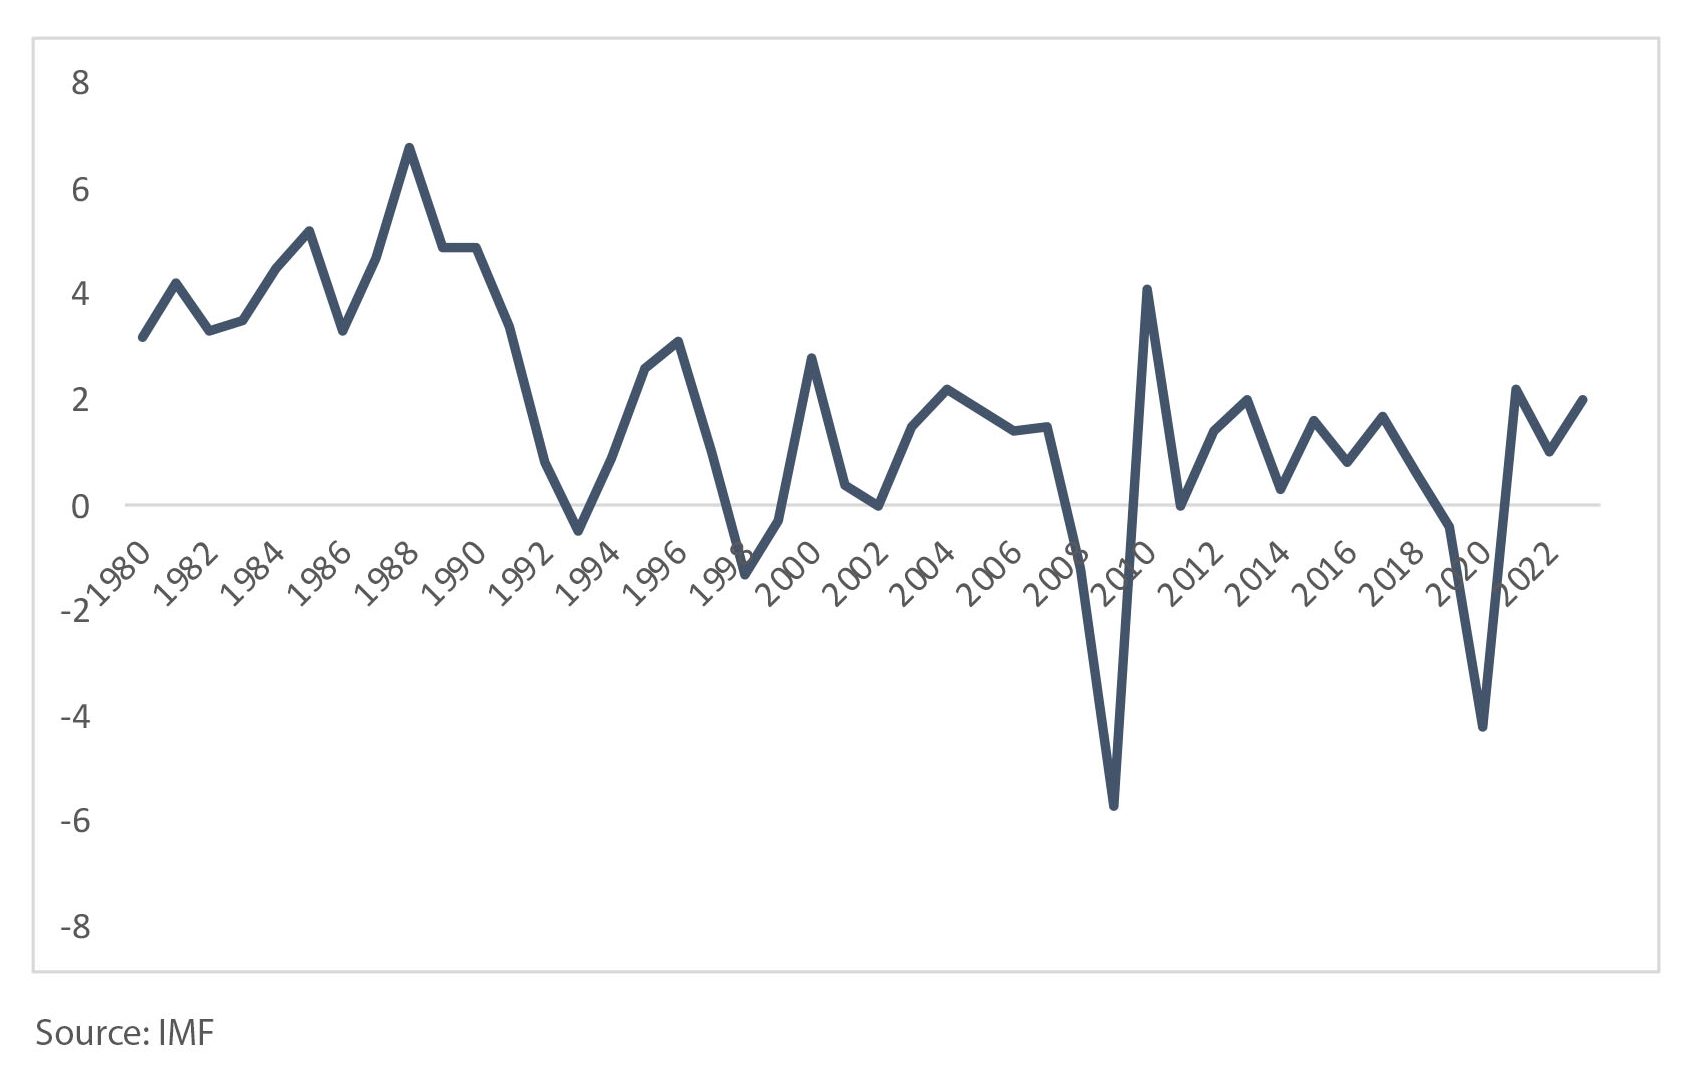
Furthermore, Japan’s real GDP growth has averaged below 1% since the 2000s (see Exhibit 12). This is not surprising, as a combination of increasing inflation alongside unchanged consumer spending and wages is not likely to support significant real GDP growth.
Recently, Japan’s slow growth led to it slipping behind Germany and losing its position as the world’s third-largest economy. If its growth stays stagnant, it could hurt consumer confidence. Investors might also view this lack of growth as a sign of economic weakness and begin selling stocks.
However, the YTD rally in the Japanese stock market appears to be indicating a contrasting narrative. Next, let us look at some possible reasons for investor optimism.
Exhibit 12 – Japan Real GDP Growth
Hopes: Rising Inflation Expectations Are a Silver Lining
Despite the challenges of increasing input inflation, there are signs that it has led to a growing expectation of inflation among Japanese consumers.
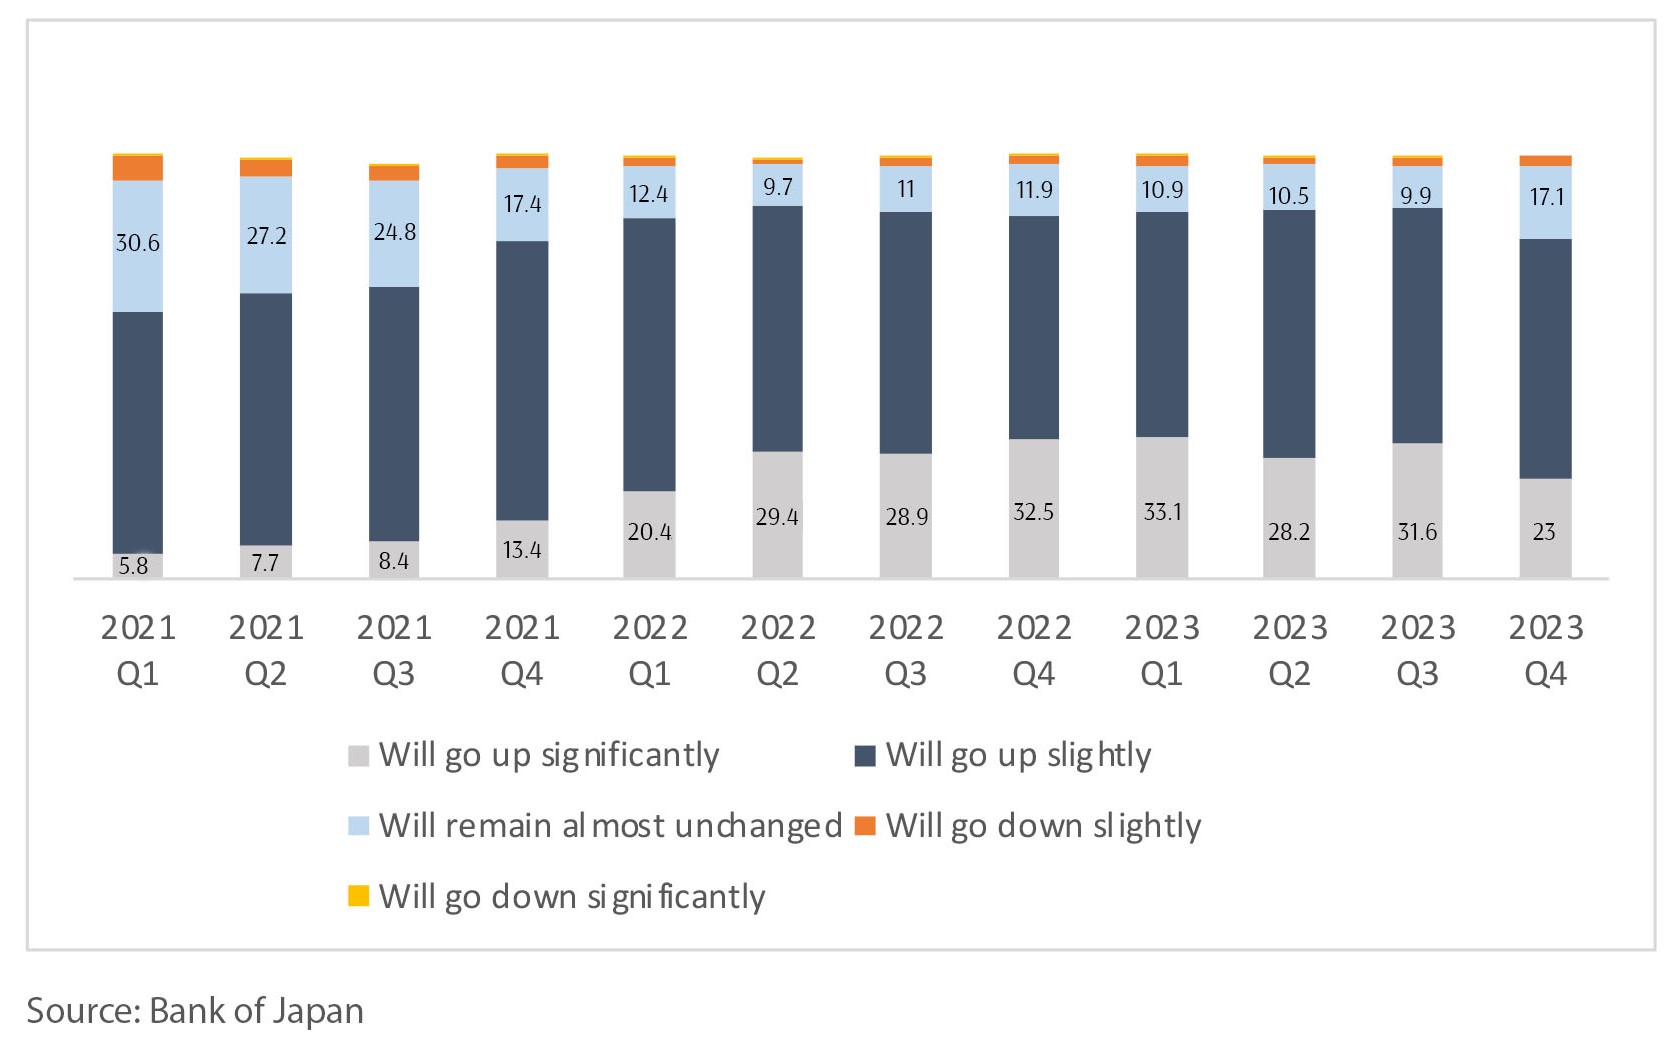
The Bank of Japan’s quarterly “Opinion Survey on the General Public’s Views and Behaviour”, surveyed 4,000 Japanese citizens on where their outlook for price levels one year from now. The percentage of people answering price levels will “go up significantly” rose from 5.8% in Q1 2021 to 23% in Q4 2023 while those that answered “almost will remain unchanged” fell from 30.6% to 17.1% in the same period as shown in Exhibit 13. Based on this survey, there is evidence that inflation expectations have risen.
Exhibit 13 – Japan’s Inflation Expectation Survey Question: “Outlook for Price Levels One Year From Now” 2021 Q1 – 2023 Q4 (%)
As inflation expectations rise, consumers may seek higher wages from their employers. In response to these increased costs, businesses frequently raise prices for their products and services, which in turn fuels inflation, creating a wage-price spiral.
This could benefit Japanese companies in two ways over time:
- Demand for higher wages can drive up costs for companies but also boost consumer confidence. This sustained confidence can lead to higher expected inflation rates, helping Japan move away from its long-standing deflation. This, in turn, can increase demand for goods and services made by Japanese companies, improve investor sentiment, and raise share prices. In fact, Japan’s union group negotiated the largest wage hike in 33 years with Japan’s biggest companies, at 5.28% for 2024, as reported by Reuters.
- As inflation rises, Japanese people may choose to invest in stocks instead of keeping cash in bank deposits to avoid losing their purchasing power over time.
Despite the attention on foreign inflows in Japan, domestic savings could significantly boost stocks, especially with the introduction of tax-free measures through the Nippon Individual Savings Account (NISA) reform in January 2024 which encourages Japanese households to invest in the stock market. This change has resulted in a surge in fund inflows, as reported by the Japan Investment Trusts Association, with funds increasing from 209 billion yen in December 2023 to 1.44 trillion yen in 2024 (see Exhibit 14), with most of these funds coming from NISA accounts.
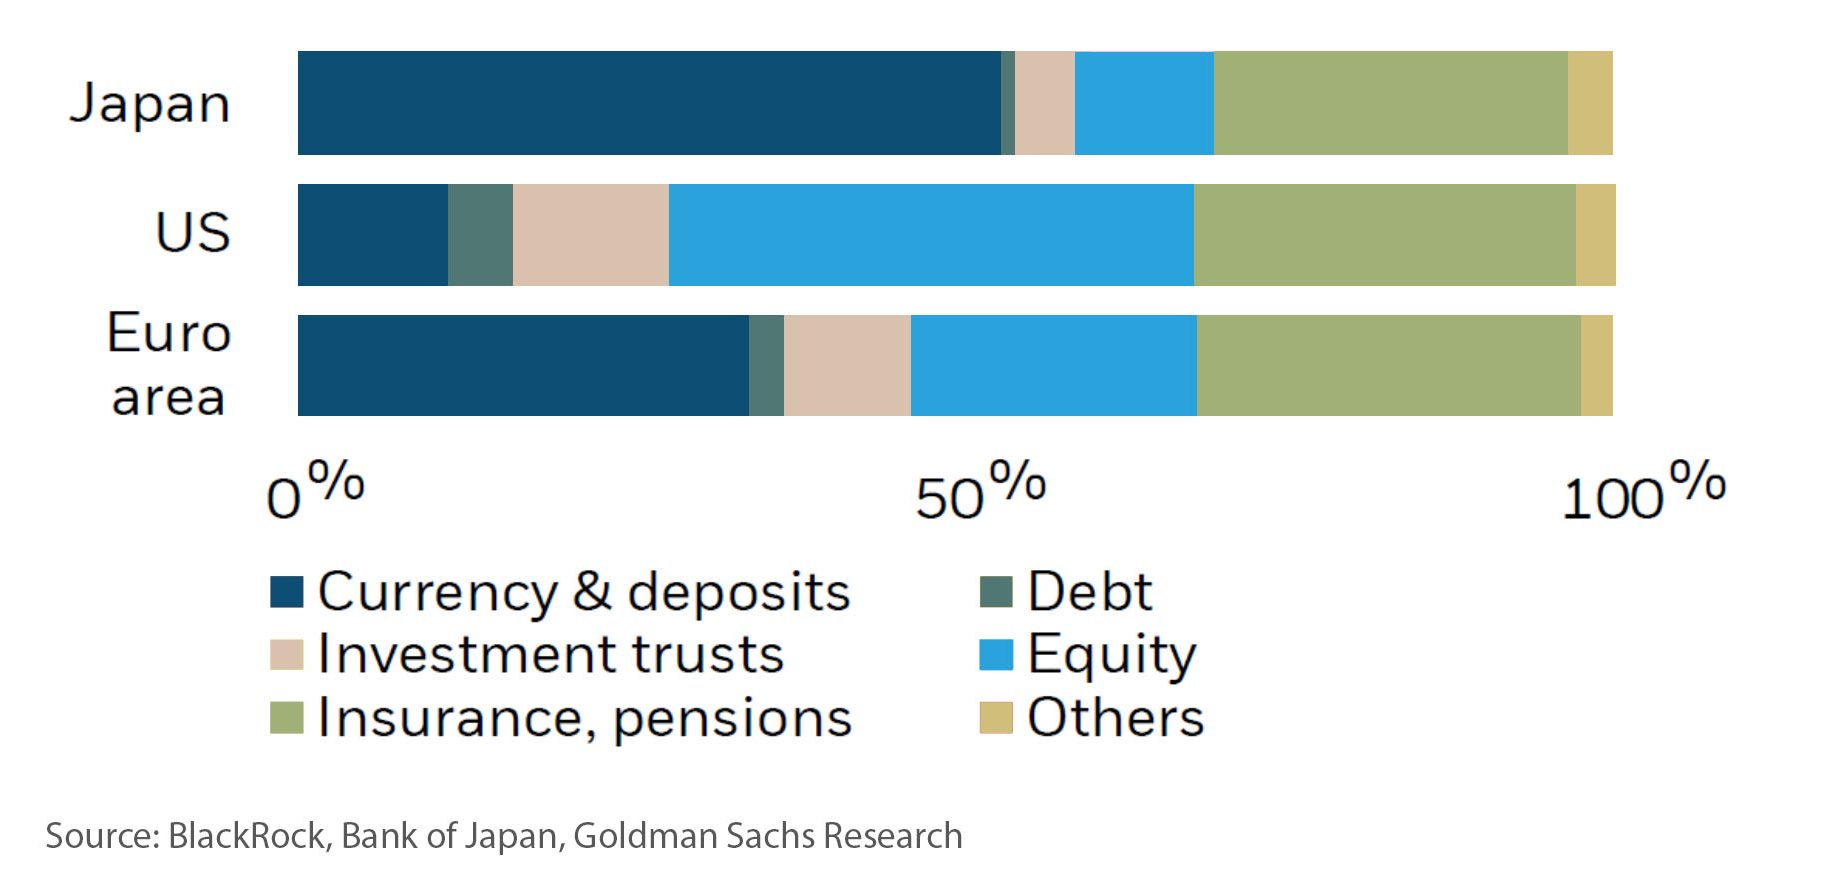
Furthermore, as seen in Exhibit 15, Japanese savers have around USD 7 trillion in household savings, mostly in cash, which could be invested in assets with higher returns.
As of March 2023, individual assets in Japan amounted to almost USD 14 trillion, with cash and savings accounting for 54% and equities just 11% of this total. This represents a significant opportunity for growth, potentially surpassing USD 1.69 trillion flowing into Japanese equities in the future, as estimated by BlackRock, if they align with asset allocation levels seen in the European Union.
Exhibit 14 – Net Inflows Into Japan Stock Investment Trusts From January 2021 – January 2024
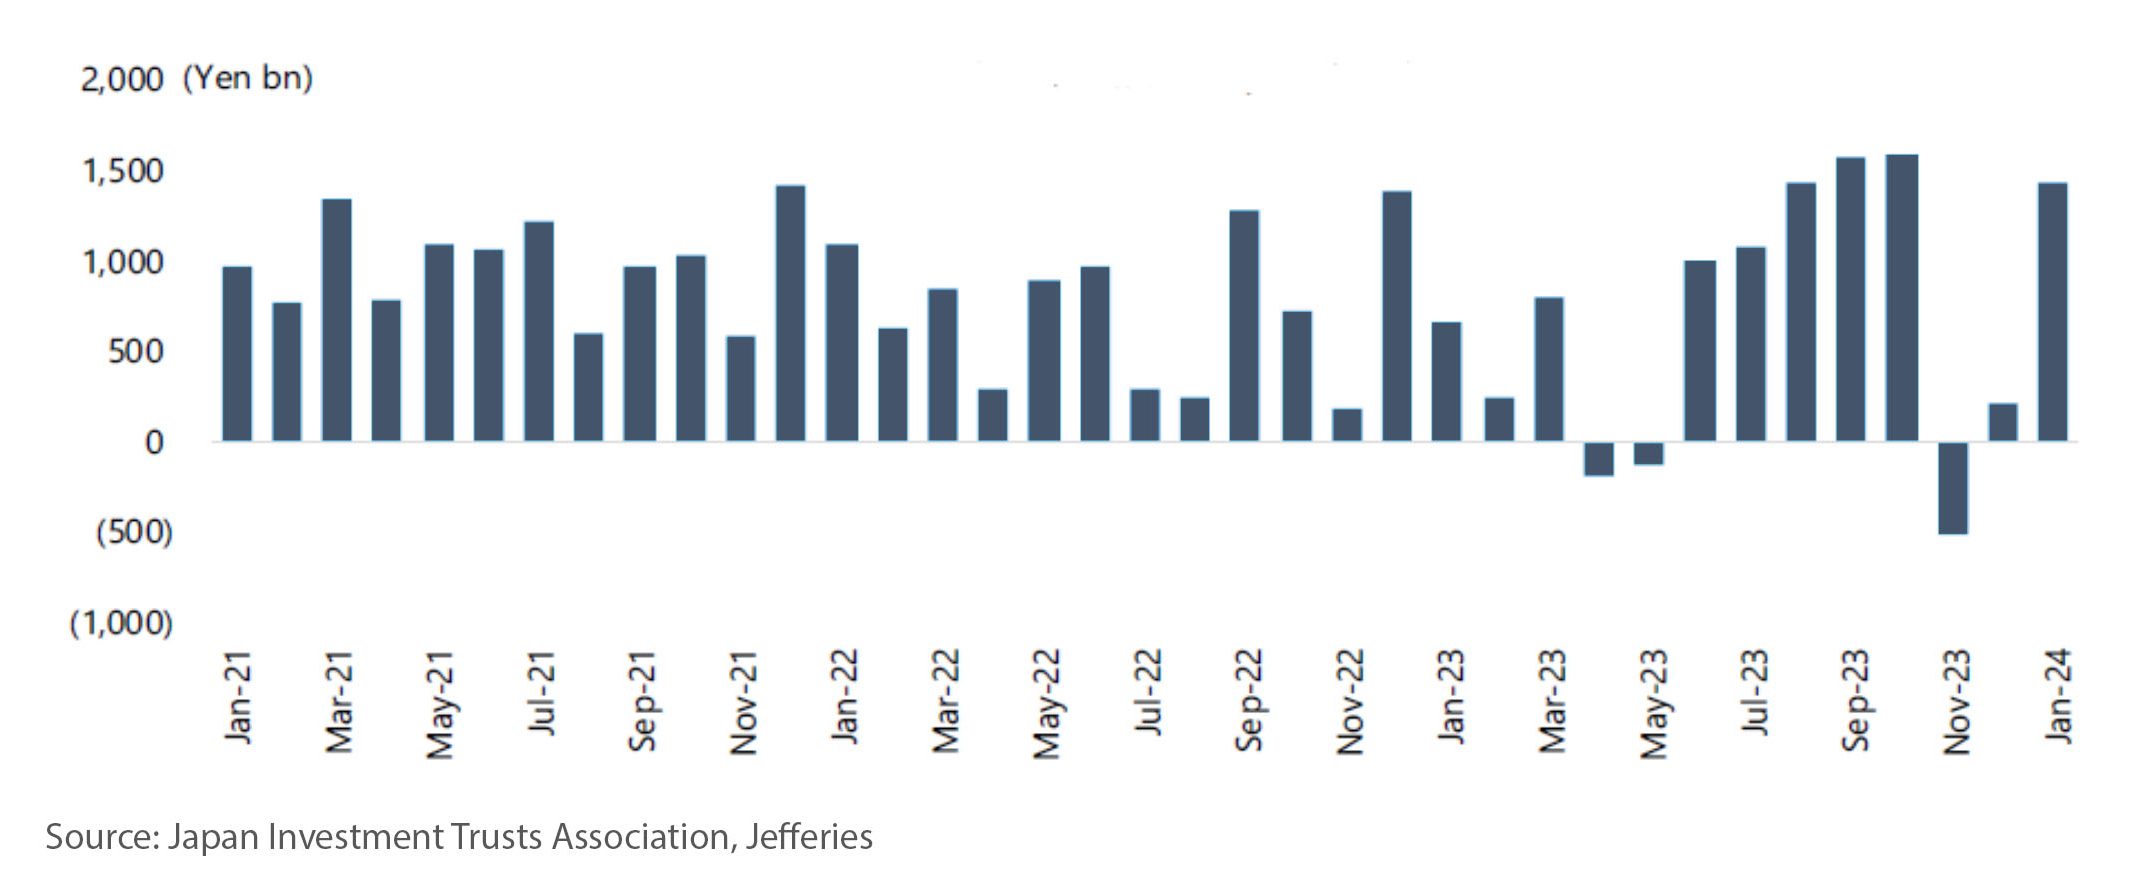
Exhibit 15 – Distribution of Household Assets Japan, US, and Euro Area (As of 1 June 2023)
Japan’s Recent Equity Performance Highlights the Importance of Diversification
In conclusion, our examination of Japan’s stock market reveals a complex mix of factors influencing its dynamics. Despite challenges like rising inflation and stagnant consumer spending, Japan’s market shows signs of resilience and adaptability.
The expectation of higher inflation has led to shifts in wage negotiations and investment patterns, suggesting potential positive developments ahead.
Diversification remains crucial for investors to manage risks and capture returns amidst these complexities. While Japanese equities have not performed for a long time, they remain a part of a globally diversified portfolio as we do not know when things will turn around. With the recent turnaround, our portfolios have benefited from the rally in Japanese equities, and this has added to the portfolio returns in the past two years.
We would like to end by saying a big thank you for your continued trust and support during these uncertain times. We hope that the new format and content for the market review have been interesting, and we look forward to sharing more about what is happening in global equity markets in the coming months.
To learn more about our purpose-driven approach towards wealth management, please visit this link.
We do not charge a fee at the first consultation meeting. If you would like an honest second opinion on your current estate plan, investment portfolio, financial and/or retirement plan, make an appointment with us today.