Bond yields in January experienced only a marginal increase, even though the Federal Reserve (Fed) ruled out the possibility of a March rate cut. In the initial part of the month, yields moved higher as the Fed doused hopes of an early rate cut. However, renewed concerns about regional bank failures on the final day of January negated most of the earlier increase in U.S. yields prompted by the Fed’s more hawkish tone.
Despite the slight increase in developed market yields, there are encouraging global signs as the inflation rate continues to exhibit signs of moderation. This has had a positive impact on the performance of developed market stocks, indicating the potential conclusion of a period marked by rising borrowing costs.
The cooling inflation suggests that central banks may no longer need to raise rates to combat escalating prices, which bodes well for companies and the equity market. In the U.S., prices experienced a slight increase in December, maintaining the annual inflation below 3% for the third consecutive month. Meanwhile, Euro area inflation rose to 2.9%, slightly below the expected 3%. At home, Singapore’s headline inflation eased to 3.7% in December, marking a decline from the peak of 7.5% in August 2022. Additionally, the Monetary Authority of Singapore (MAS) revised its inflation forecasts for 2024 to 2.5–3.5%, down from the previous range of 3–4%.
This news is particularly positive not only because it signals the potential end of rising borrowing costs but also represents a reduction in the erosion of purchasing power for consumers. Furthermore, it suggests the possibility of increased real returns for investors, positively influencing both your planning and actual returns.
However, as we can see from the market moves in January, interest rates set by Central Banks will still be one of the key drivers of market performance both for equities and bonds this year.
Exhibit 1 – Market Index Performance: January 2024 (USD)
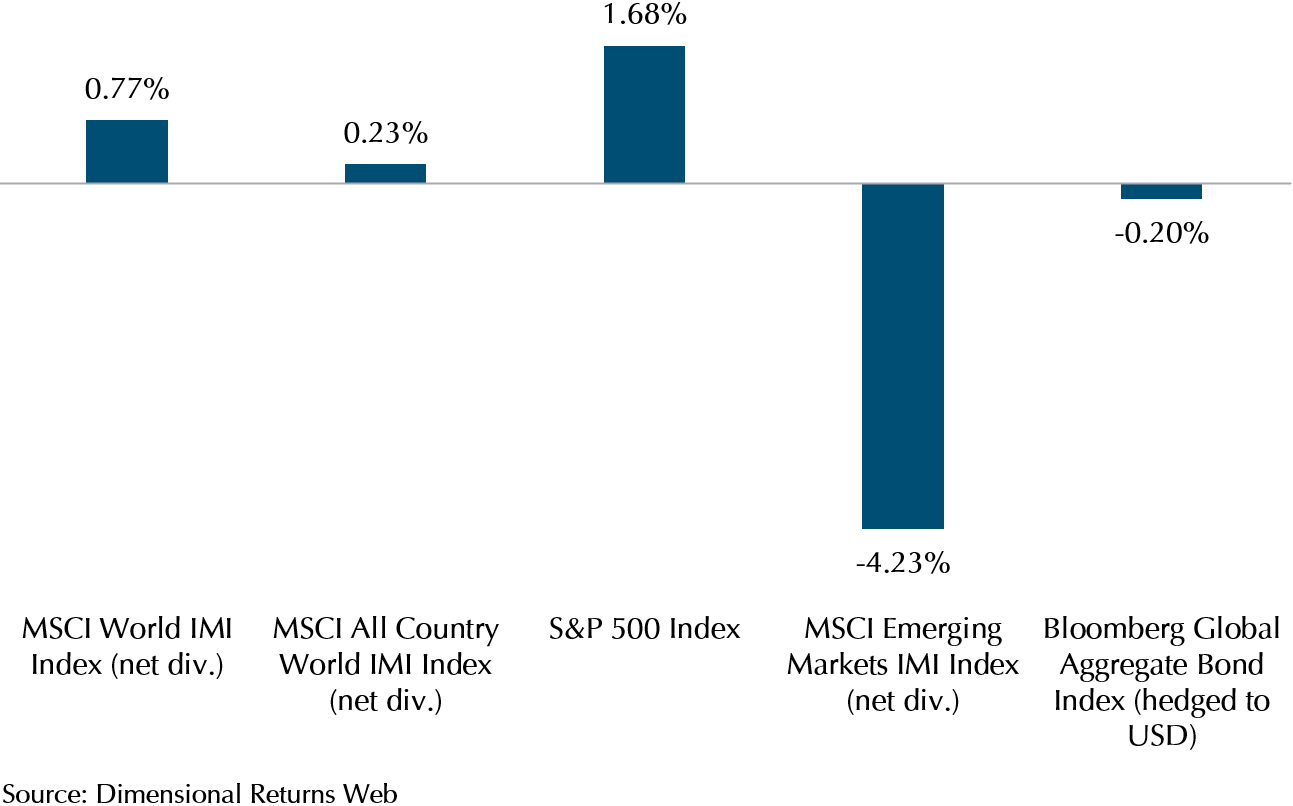
Exploring the market’s performance, Exhibit 1 depicts the January performance of market indexes. The MSCI World IMI, encompassing large, mid, and small-sized developed market companies, witnessed a climb of 0.77%, while the MSCI All Country World IMI, covering both developed and emerging market stocks, recorded a growth of 0.23%. The S&P 500, representing the largest 500 publicly traded U.S. companies, surged by 1.68%, reaching an all-time high, propelled by the Magnificent Seven stocks that lifted the U.S. market index out of its 2022 depths.
In contrast, the MSCI Emerging Market IMI, reflecting large, mid, and small-sized companies, experienced a decline of 4.23%, because Chinese stocks fell in January, and are a large weight in the index.
China faced persistent deflation for the third consecutive month in December 2023, marked by a 0.3% drop in the Consumer Price Index (CPI) and a slowdown in annual growth. Moreover, the court-ordered liquidation of Evergrande in Hong Kong, has the potential to initiate a domino effect, further impacting other real estate peers. Thus, concerns around economic growth and the continued challenges of its real estate sector which comprises 25-30% of its GDP continue to be a drag on Chinese equities.
Turning our attention to fixed income, the Bloomberg Global Aggregate Index (hedged to USD), which reflects global investment-grade fixed-income markets, registered a negative return of 0.20% as the yields in developed markets rose.
Developed Market Equities Is Not Just About the S&P 500
While the Magnificent Seven continues to play a crucial role in driving the U.S. market rally with AI optimism spillover from December to January, Europe has also demonstrated noteworthy performance this time.
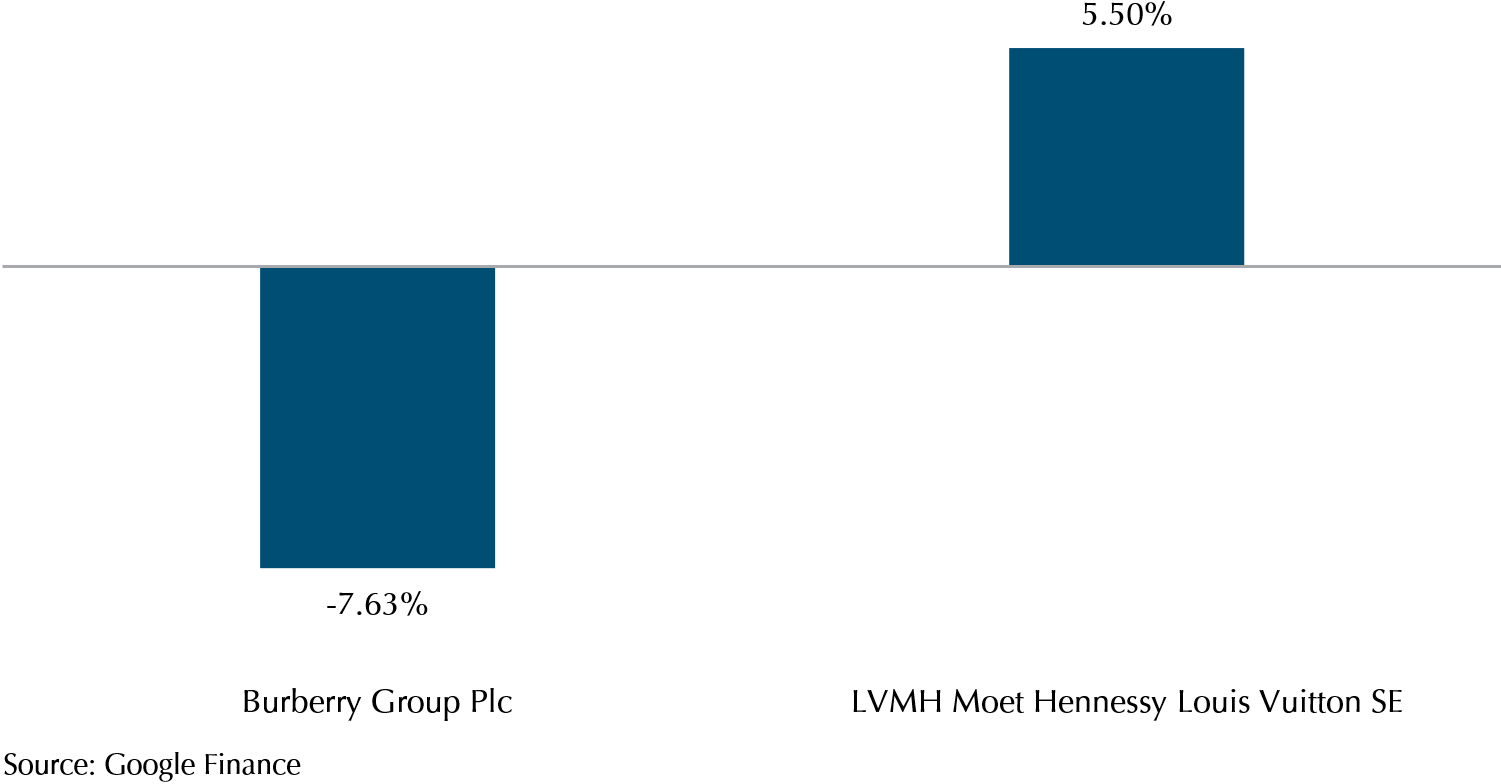
The pan-European STOXX Europe 600 Index closed 1.39% higher in January, propelled by positive corporate results and news of additional stimulus measures in China. This development suggests the possibility of increased demand for European goods from the Chinese market. Notably, luxury fashion house LVMH, which has a 2% weight in STOXX Europe 600, soared 5.5% as increased fourth-quarter sales signalled a boost for the luxury sector. The European Central Bank (ECB) also played a role in lifting stocks as it maintained unchanged interest rates and signalled a more dovish outlook.
Major stock indexes across Europe demonstrated positive movement, with the France’s CAC 40 Index climbing by 1.51%, the Germany’s DAX advancing by 0.91%, and the Italy’s FTSE MIB gaining 1.29%. However, the UK’s FTSE 100 Index experienced a 1.33% decline, as retail sales volume fell 3.2% in December as reported by the UK Office for National Statistics surpassing the expected fall of 0.5% by economists. In the same month, Burberry, the UK fashion house that has a 0.42% weight in FTSE 100, reported disappointing December retail sales results, resulting in a 7.63% decline.
The divergence in the performance between two luxury powerhouses, from UK and France, highlights the importance of diversification, across sectors and geography. Exhibit 2 provides a comparison of the percentage of price change in January between LVMH and Burberry.
Exhibit 2 – LVMH vs Burberry Share Price YTD % Change
Dimensional Funds Performance Review
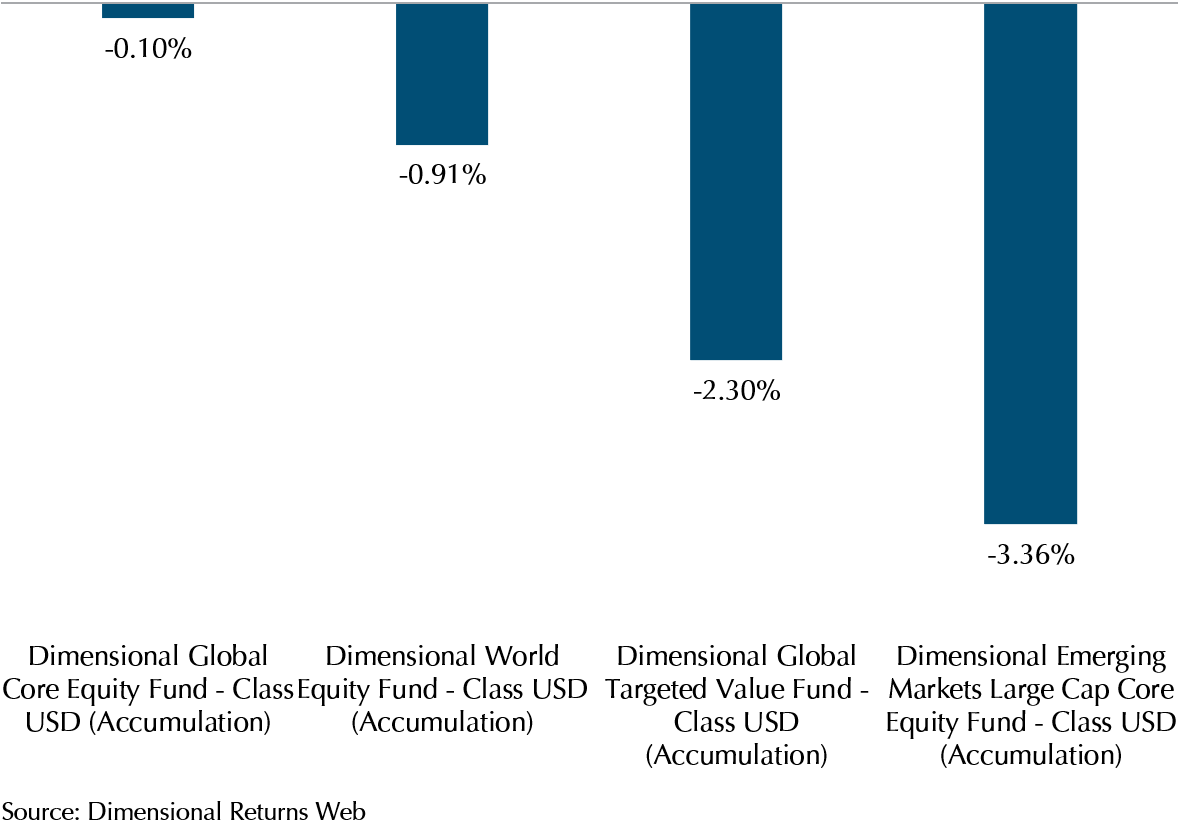
Next, we delve into the Dimensional Equity Funds, exploring how they fared in January. A large part of the developed market returns can be attributed to the Magnificent Seven performance. However, the Dimensional funds employ value and size strategies that typically underweight these seven stocks as they are large cap growth stocks, so their performance has lagged that of the indexes. Furthermore, U.S. regional banks stocks, which are predominantly value and small-to-mid cap stocks and therefore in the funds, contributed to the negative relative performance after falling significantly on the last day of January, as U.S. regional bank New York Community Bancorp reported a huge loss in Q4 2023, incurred from loans tied to commercial real estate loans, particularly office buildings.
Consequently, the Global Core Equity Fund experienced a fall of 0.1%, while the World Equity Fund and the Global Targeted Value Fund recorded declines of 0.91% and 2.30%, respectively (see Exhibit 3).
In the emerging market, despite the Emerging Markets Large Cap Core Equity Fund experiencing a decline of 3.36%, it exceeded the market index, the MSCI Emerging Market Index, by more than 1%. This superior performance is linked to the outperformance of value and smaller-cap stocks compared to the indexes in the emerging market region. Notably, Dimensional’s higher-than-average allocation in the energy sector played a positive role in its performance relative to the index.
The negative relative performance of the Dimensional funds this month due to the tilts towards value and small companies is unfortunate. However, in the longer term, there have been significant premiums from investing in value and smaller companies. Apart from the outperformance of the Emerging Markets fund this month, we would also like to draw attention to the fact that as of the end of December 2023, the three-year performance of the Global Core Equity fund was 7.32% vs the MSCI World 7.27%, so this highlights that while there can be short periods of underperformance, over time, having some exposure to value and small companies can deliver higher than market or index returns.
Exhibit 3 – Dimensional Equity Funds Performance: January 2024 (USD)
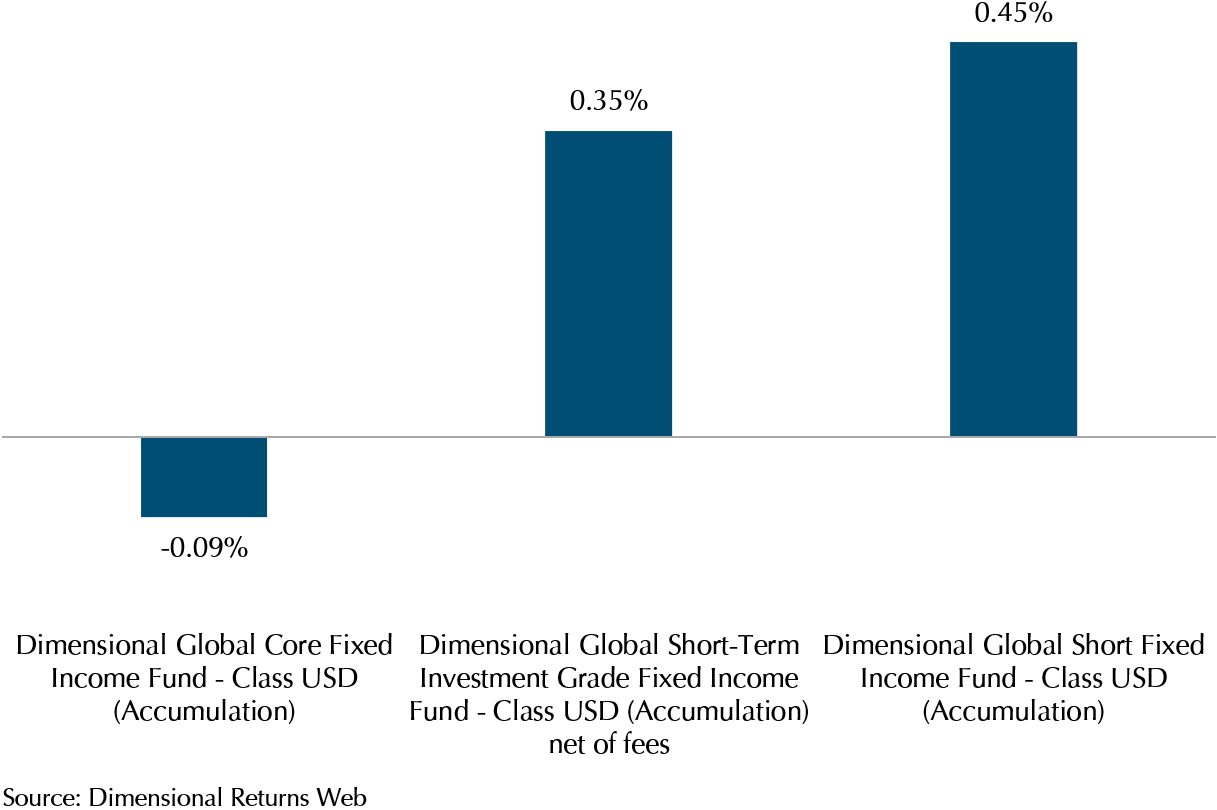
Shifting our attention to the fixed income funds, the Global Core Fixed Income Fund experienced a decline of 0.09% as developed market yields increased slightly. In contrast, the Global Short-Term Investment Grade Fixed Income Fund and the Global Short Fixed Income Fund demonstrated resilience, posting gains of 0.35% and 0.45%, respectively (see Exhibit 4). The funds hold short-term bonds, which are less sensitive to rises in yields, therefore shielding the portfolios from the negative returns experienced by longer-duration bonds. Once more, this underscores the significance of diversification, even in duration.
Exhibit 4 – Dimensional Fixed Income Funds Performance: January 2024 (USD)
Refresher: Why Is Diversification Important?
In the 10 years leading up to December 31, 2023, the S&P 500 Index achieved a cumulative return of 211.5%, significantly surpassing the returns of 52.6% for the MSCI World ex USA Index and 30.0% for the MSCI Emerging Markets Index (see Exhibit 5). With U.S. stocks outperforming global stocks in most years over the past decade, investors might be wondering if there are any benefits of expanding their investment diversification beyond the United States. However, relying solely on return differences over a relatively short period introduces a recency bias and may lead to overlooking potential opportunities presented by global markets.
Despite developed market ex-U.S. and emerging markets stocks delivering comparatively lower returns than their U.S. counterparts in the past decade, it is crucial to bear in mind two important points:
- Non-U.S. stocks contribute valuable diversification benefits.
- Recent performance is not a reliable predictor of future returns.
To assess the potential opportunity cost of neglecting global diversification, one can reflect on the period from 2000 to 2009, commonly termed the “lost decade”.
While the S&P 500 Index recorded its worst-ever 10-year performance with a cumulative return of – 9.1%, global equity investors experienced more favourable conditions, as most equity asset classes outside the U.S. generated positive returns during that decade (see Exhibit 5).
Expanding this perspective to examine performance across each of the 11 decades from 1900 to 2010, the U.S. market outperformed the world market in five decades and underperformed in the other six.
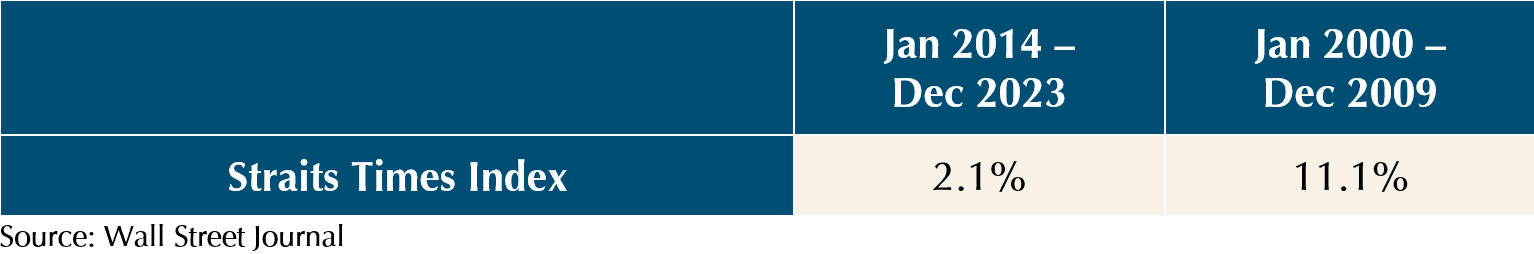
Furthermore, bringing this comparison to Singapore, while there are valid reasons for a Singapore-based investor to prefer a certain level of home bias in their equity allocation, solely investing in Singapore equity would mean missing opportunities to capture higher returns available in global markets. Exhibit 6 illustrates this point, showing the Straits Times Index returning a meagre 2.1% and 11.1% in the decades spanning January 2014 – December 2023 and January 2000 – December 2009, respectively.
Holding a globally diversified portfolio positions investors to capture returns wherever they may arise.
Exhibit 5 – Global Index Cumulative Returns (Jan 2014 – Dec 2023 vs Jan 2000 vs Dec 2009)
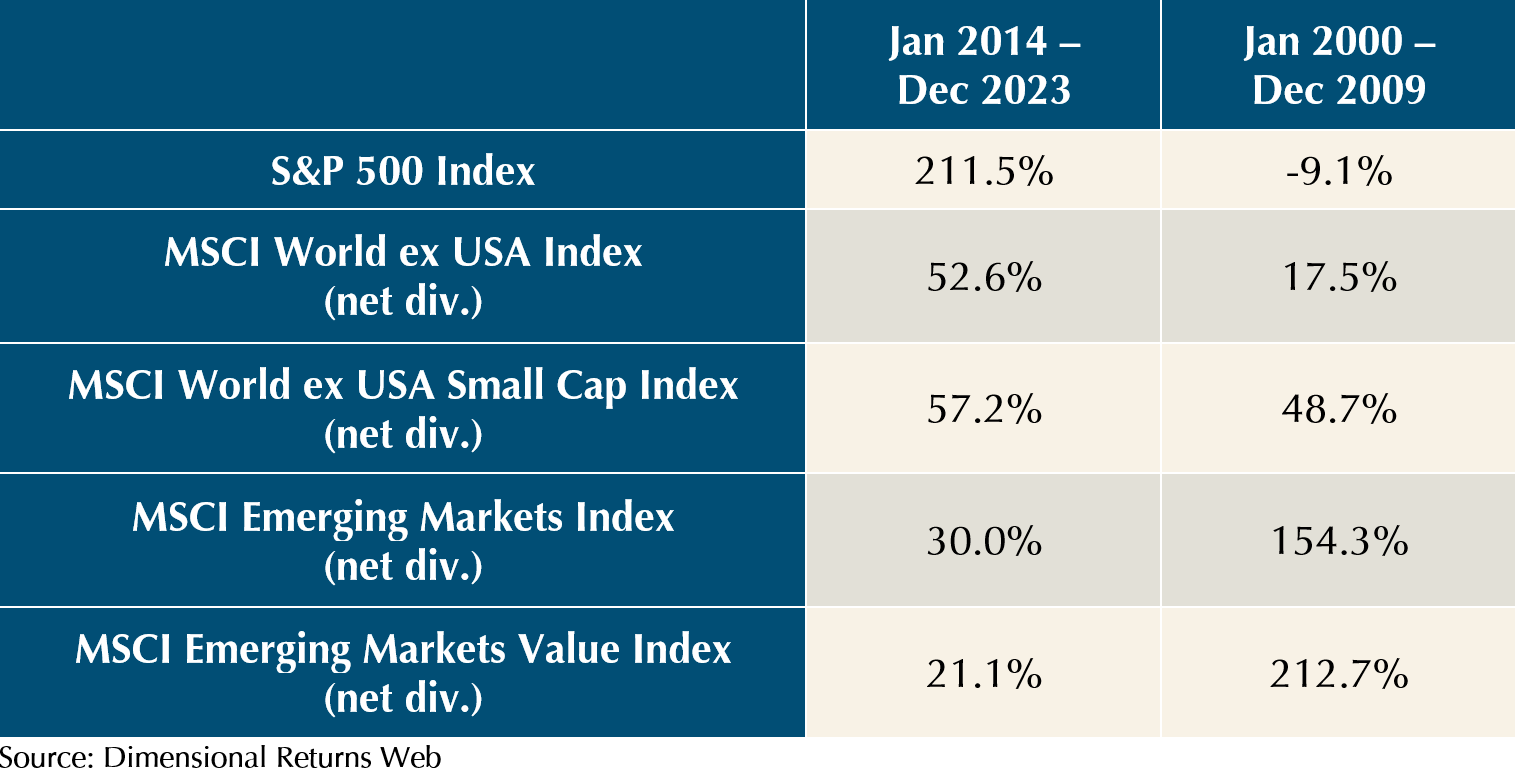
Exhibit 6 – The Straits Times Index Cumulative Return (Jan 2014 – Dec 2023 vs Jan 2000 vs Dec 2009)
Staying Diversified Works in the Long Term Despite Short-Term Challenges
In conclusion, while investors can anticipate a market premium in both U.S. and non-U.S. equities over the long run, it is essential to recognise that short-term performance disparities between these asset classes can be significant. Therefore, embracing the global opportunity set not only provides diversification benefits but also helps mitigate inherent risks within each market.
As we partner with you in navigating your wealth journey, staying invested in a diversified portfolio will help you stay aligned with your long-term goals. However, as your life circumstances and goals evolve, our Client Advisers are here to assist you with any necessary adjustments.
Your continued trust and support are invaluable to us, and we express our sincere gratitude for the privilege of assisting you on your wealth journey. Thank you for letting us be part of your life journey.
Wishing you a joyous and prosperous Chinese New Year. May the Year of the Dragon bring you prosperity and fulfilment. Gong Xi Fa Cai!
We do not charge a fee at the first consultation meeting. If you would like an honest second opinion on your current estate plan, investment portfolio, financial and/or retirement plan, make an appointment with us today.