


September Market Summary
Bond markets set the tone in September. The Federal Reserve raised interest rates on 16 September for the first time since July 2023, and Treasury yields rose to levels last seen before the 2008 global financial crisis. Global equities eased, with the MSCI All Country World IMI down 1.41%, and returns diverged widely beneath the index. The Nasdaq 100 rose 3.30% on a renewed rally in semiconductors and AI-linked technology, while the S&P 500 slipped 0.35% and the Russell 2000 fell 5.21%.
Higher US rates also lifted the dollar and weighed on precious metals. The US Dollar Index rose 2.03%, while gold fell 6.57%, giving back part of August’s gains. Brent crude rose 14.41% as an attack shut Saudi Arabia’s East-West pipeline mid-month. While crude exports from the Persian Gulf have largely returned to pre-war levels, tightness in diesel, jet fuel and natural gas on the back of damage to refineries and LNG facilities in the Middle East and Russia has cut supply and pressured energy costs.
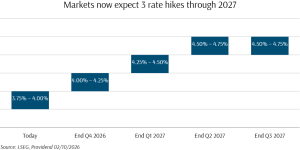
The 25-basis point hike was well anticipated after August consumer prices rose 0.4% on the month, prompted by a 3.9% rise in gasoline. Federal Reserve messaging was firmer than many expected, and markets moved to price about 75 basis points of further tightening before softer inflation data at the end of the month ultimately pushed the expected timing of the next hike out to December.
September’s rise in yields was global in nature, as energy-driven inflation led markets to price hiking cycles across developed economies. Heavy government borrowing and the funding needs of the AI build-out have also lifted real yields. While the recent move in global yields has not been excessively large in absolute terms, the pace of the advance has been swift.
Beneath broad indices, the declines in sectors outside technology were more apparent. Aerospace and defence fell 9.16%, materials fell 7.15% and financials fell 7.14%, while real estate, consumer discretionary and utilities each fell about 6%, and energy declined 3.26% despite the rise in crude oil prices. Rate-sensitive sectors and smaller companies were hit hardest as markets priced a hiking cycle, and the Dow Jones Industrial Average fell 4.11%, finishing more than 7% behind the Nasdaq 100. Gains were largely confined to technology, where leadership in the AI trade moved from the hyper-scalers to chipmakers, security software and companies putting AI to commercial use.
Emerging markets fell less than developed markets, with the MSCI EM IMI down 0.72%. Taiwan’s TAIEX rose 4.09% and Korea’s KOSPI rose 0.98%, extending their gains as the main AI hardware markets. Greater China lagged, with the Hang Seng falling 3.28% and the FTSE China A50 falling 4.59%, ahead of targeted fiscal and monetary easing announced on 29 September. Singapore’s STI fell 1.37%, while Japan’s TOPIX fell 0.27%.
Providend’s factor-tilted portfolios trailed the market-cap benchmarks in September. With gains concentrated in a small group of large technology companies, the value and small cap tilts detracted. Fixed income funds largely declined as yields rose.
This month’s investment questions section looks at the Fed’s September decision, how far the new rate cycle is likely to run, and its implications for bonds, the dollar and gold. Despite September’s declines, diversified investors enter the final quarter with solid year-to-date gains and higher income from the bond allocation.
Equity Market Performance
US Equities
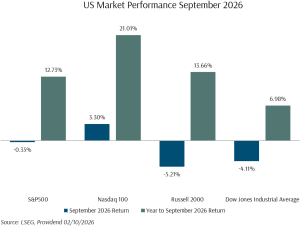
The S&P 500 fell 0.35% in September, while the Nasdaq 100 rose 3.30%. The Dow Jones Industrial Average fell 4.11% and the Russell 2000 fell 5.21%, as the move to rate hikes weighed most on smaller and more rate-sensitive companies. Year-to-date, the S&P 500 is up 12.73%, while the Nasdaq 100 is up 21.01%.
Amongst sectors, gains were concentrated in technology. Semiconductors rose 9.41%, technology rose 5.08% and the Magnificent Seven gained 4.29%, with Meta rising about 27% since the 8 September launch of its Muse AI agent. Oracle reported 121% growth in cloud infrastructure revenue and a USD 664 billion backlog, and AMD joined the trillion-dollar market value club, while software, which led August with a 16.28% gain, fell 3.18%. Large cap growth was the only style ahead of the S&P 500, outperforming by 2.35%. Small caps trailed by about 4.9% across core, value and growth, while large cap value trailed by 2.76%.
Economic data largely held firm. Nonfarm payrolls rose 162,000 in August, against expectations of 55,000, and the unemployment rate held at 4.1%. Headline inflation held at 3.4% year-on-year, while core inflation eased to 2.4%, its lowest level since March 2021. Core PCE inflation for August was revised to 3.01%, below the Fed’s 3.4% projection for 2026. Second-quarter GDP growth was revised up to 2.2% from 1.5%, the flash September services PMI rose to 58.7 and the manufacturing PMI rose to 57.0.
So far in 2026, the US economy appears to have absorbed higher rates and oil prices with limited damage. Higher equity prices and narrower credit spreads have offset much of the rise in interest rates, leaving 2026 growth forecasts close to where they started the year. Housing has been the weakest segment, and higher fuel costs have fallen mainly on consumer spending power.
Exhibit 1: Us Stock Market Performance September 2026 (USD)
International equities
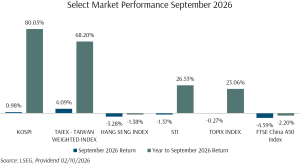
Asia’s technology markets led again. Taiwan’s TAIEX rose 4.09% and Korea’s KOSPI rose 0.98%, taking their year-to-date gains to 68.20% and 80.05% respectively, as demand for AI hardware and memory continued to lift earnings. AI investment has also cushioned the region’s technology exporters from the energy shock. Taiwan’s economy is forecast to grow 11.7% in 2026, while Korea’s is forecast to grow 3.7% and Singapore’s is forecast to grow 5.4%. Elsewhere, Japan’s TOPIX slipped 0.27% and Singapore’s STI fell 1.37% from August’s record highs.
Greater China was the weakest part of the region. The Hang Seng fell 3.28% and the FTSE China A50 fell 4.59%, leaving both down for the year. On 29 September, following Premier Li’s call for stronger counter-cyclical measures, policymakers announced targeted fiscal and monetary easing to support the full-year growth target. Valuations remain low, with MSCI China at about 10 times forward earnings, and China’s 10-year government bond yield ended the month at 1.68%, close to an all-time low, in stark contrast to the rise in yields throughout the rest of the world.
Exhibit 2: Select Market Performance September 2026 (Local Currency)
Global summary
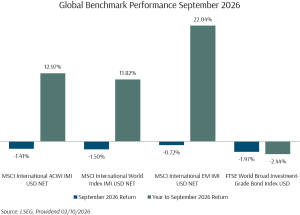
The MSCI All Country World IMI returned -1.41% in September, with the MSCI World IMI down 1.50% and the MSCI EM IMI down 0.72%. Year-to-date, the MSCI ACWI IMI is up 12.97%, while the MSCI EM IMI is up 22.04%.
Exhibit 3: Global Equity Benchmark Index Performance September 2026 (USD)
Cross-Asset Performance
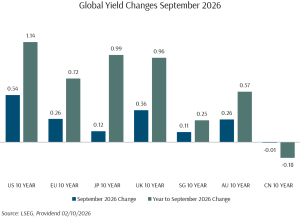
The US 10-year Treasury yield rose 53.5 basis points to 5.29%, while the 2-year yield rose 53.7 basis points to 4.89%. The UK 10-year yield rose 36.4 basis points and the euro area 10-year yield rose 26.2 basis points, while the Australian 10-year yield rose 25.7 basis points and the Japanese 10-year yield rose 12.2 basis points. Singapore’s 10-year yield rose 11.3 basis points, while China’s fell 0.8 basis points. The FTSE World Broad Investment-Grade Bond USD Index returned -1.97%, taking its year-to-date return to -2.44%. In credit, AI-related borrowing continues to add supply. Hyperscaler bond issuance has reached USD 182 billion so far this year, against USD 93.3 billion in all of 2025; as a result, technology bond spreads have widened by about 40 basis points relative to the broader market.
Exhibit 4: Global Yield Changes September 2026
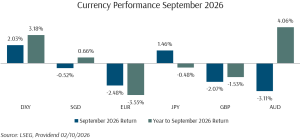
The US Dollar Index rose 2.03%, gaining against most major currencies except the yen, which rose 1.46%. The Australian dollar fell 3.11%, the euro fell 2.48% and sterling fell 2.07%. The Singapore dollar eased 0.52% against the US dollar, holding up better than most other major currencies.
Exhibit 5: Currency Performance September 2026
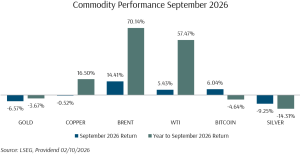
Oil led the commodity complex. Brent rose 14.41% and WTI rose 5.43%, taking Brent’s year-to-date gain to 70.14%. Gold fell 6.57%, silver fell 9.25% and copper slipped 0.52%. Bitcoin rose 6.04%, adding to August’s 25.38% gain, and remains 4.64% lower for the year.
Exhibit 6: Commodity Performance September 2026
How Did Our Portfolio Funds Do in September?
Exhibit 7: Equity Fund Performance September 2026 (SGD)
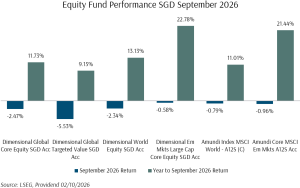
The factor-tilted funds underperformed in September, as the rally in large technology shares and the decline in smaller and value companies both worked against the Dimensional tilts. The DFA Global Targeted Value Fund returned -5.53% in SGD terms and the DFA Global Core Equity Fund returned -2.47%, while the Amundi MSCI World Index Fund returned -0.79%. The DFA World Equity Fund returned -2.34%.
The DFA EM Large Cap Core Equity Fund returned -0.58%, ahead of the Amundi Core MSCI EM Fund at -0.96%. Year-to-date, the DFA Global Core Equity Fund has returned 11.73% in SGD terms, against 11.01% for the Amundi MSCI World Index Fund, while the DFA EM Large Cap Core Equity Fund has returned 22.78%, against 21.44% for the Amundi Core MSCI EM Fund. The DFA Global Targeted Value Fund, which led for much of the year, has returned 9.15%. The value and small cap premiums have historically been earned over long periods, with stretches of underperformance along the way. September’s factor weakness was largely attributable to the rapid rise in yields over the month. With the rate move mostly played out, we anticipate that factor premiums will return to positive standing as we head into year’s end.
Exhibit 8: Fixed Income Fund Performance September 2026 (SGD)
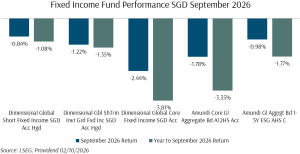
Duration drove the dispersion in fixed income returns. The DFA Global Core Fixed Income Fund returned -2.44% in SGD terms and the Amundi Core Global Aggregate Bond Fund returned -1.78%. The shorter-duration DFA Global Short Fixed Income Fund returned -0.84%, while the DFA Global Short-Term Investment Grade Fixed Income Fund returned -1.22%.
Investment Questions: The Fed’s New Rate Cycle
Q1: What did the Fed do in September, and Why?
On 16 September the Federal Open Market Committee raised the federal funds target range by 0.25% to 3.75-4.00%, with no dissents. The statement stated that inflation “remains elevated” and that the move “will support a timelier return” to the 2% goal, and described economic activity as expanding at a solid pace, with strong productivity growth and job gains keeping pace with the workforce.
When asked what had changed since July, Fed Chair Warsh gave three reasons: Economic growth, including the labour market, had strengthened; the trend in inflation had not improved enough; and geopolitical developments had raised commodity prices. Energy was cited directly as a source of persistent inflation, a shift for a central bank that has usually looked through energy supply shocks.
Q2: What Were Markets Expecting, and How Did They React?
Markets had priced most of the move in advance. The probability of hikes through 2027 rose quickly in early September, and by 14 September futures priced about a 90% chance of a September hike and roughly four 25 basis point increases by the end of July 2027. That pricing was more hawkish than the Fed’s own projections, so the decision itself caused little lasting damage in equity or bond markets.
The messaging was firmer than analysts expected. Sixteen of 18 participants projected at least two hikes this year, which makes a second hike close to a consensus position, and Chair Warsh said the move “starts to show we are serious”. He avoided language suggesting a single, limited adjustment, and when asked whether this would differ from a traditional hiking cycle, he said he does not give forward guidance. The median estimate of the long-run funds rate also rose to 3.25% from 3.06%.
Q3: How Many More Hikes Should We Expect?
One more hike in 2026 looks close to certain unless inflation slows sharply, which would take the funds rate to 4.00-4.25% by year end. If market pricing proves correct, and it often does, two to three hikes in 2027 would follow, leaving the funds rate between 4.50% and 5.00% at the end of next year. That would make this a short cycle, raising rates by about 1% in total through 2027.
Market expectations do move quickly, and since the softer inflation data at the end of September, forecasters have limited their expectations for 2026 to one more hike, pushing the expected timing out to December versus October prior.
Q4: Could This Become a Long Hiking Cycle Like 2022?
We think this is unlikely at this stage. Energy was the main source of the inflation persistence the Fed cited, and energy prices can reverse quickly. Assuming the conflict in the Middle East is eventually resolved, oil prices should return to lower levels.
Underlying conditions also point to a short cycle. Labour market conditions are moderate and the economy shows little sign of overheating. Core CPI inflation is at a five-year low of 2.4%, inflation expectations remain stable, and the effect of tariffs on prices is starting to fade. The 2022 cycle was a different episode, with the Fed raising rates by 4.25% in a single year as core inflation ran at around 6%. Further evidence of cooling inflation would more likely reduce the number of hikes priced than extend the cycle.
Q5: What Does a Hiking Cycle Mean for Bonds, the Dollar and Gold?
Bond prices fall when yields rise, as September’s returns showed. Much of the expected cycle is now reflected in yields, however, and if further hikes are already priced, longer-term yields need not rise alongside the policy rate. The US 10-year yield has risen 114 basis points this year to about 5.3%, above its 250-year average of about 4.7%. Higher starting yields raise the income bonds earn, which offsets price declines over time, and make bonds more of an income source than a hedge for equities.
It is too early to conclude that short-term rates elsewhere in the world will follow, though in larger cycles they have tended to, so Singapore short-term rates may also rise. A hiking cycle generally supports the US dollar and is likely to weigh on gold in the short term. Nevertheless, sell-side commodity strategists continue to cite central bank buying as longer-term support for gold.
Q6: What Does This Mean for My Portfolio?
For a globally diversified, long-term portfolio, staying the course remains the best advice. A short hiking cycle in response to an energy shock is, by nature, a temporary shock that a diversified portfolio should easily absorb. Since the 1970s, global equities have tended to see some pressure over three months following the initial rate hike, but have gained about 7% on average in the 12 months following the event.
Within equities, earnings estimates continue to rise and valuations have eased this year. Correlations between individual stocks are at multi-year lows across major markets, which favours spreading exposure across regions, sectors and factors over concentrating it in the market’s recent leaders. Conservative planning assumptions and staying invested through periods of volatility remain the basis of our approach.
Looking Forward to October 2026
October began on a steadier footing. On 1 October the S&P 500 rose 0.29% and the Nasdaq rose 0.25%, while the 10-year Treasury yield touched 5.34%, its highest since 2002, before closing at 5.24%. Oil extended its gains after reports that China had suspended fuel exports for October.
The inflation picture is more encouraging than September’s rate moves suggest. The revised core PCE data, the Fed’s preferred measure, put August inflation at 3.01% year-on-year against the Committee’s 3.4% projection for 2026, and the three-month annualised pace slowed to 2.05%, the softest in about two years and close to the 2% target. Revisions of this size weaken the case for a series of hikes, and prediction markets now give about a 64% chance of a hold at the 28 October meeting, a week before the 3 November midterm elections. Some price pressure remains, with the prices paid component of the September ISM manufacturing survey rising to 77.9 from 71.1, and the September employment report, due on 2 October, is the next test.
Third-quarter earnings season begins with the major banks on 13 and 14 October. S&P 500 earnings are expected to grow about 24% year-on-year, which would be an eighth consecutive quarter of double-digit growth, and upward revisions have been concentrated where AI investment, oil and higher rates lift profits, in technology, industrials, energy and financials.
Oil and yields remain the main risks. Iran’s proposal to reopen the Strait of Hormuz was rejected on 28 September, and a settlement now looks unlikely before the mid-term elections. While crude oil shipments through the Straits of Hormuz have returned to 2025 levels, Iranian flows are virtually non-existent, a situation which will eventually back the Iranian government into a corner, and consequently raises the possibility of a desperate escalation in affairs, aimed at creating more widespread damage to regional energy facilities.
With regards to US politics, prediction markets currently give Democrats more than a 90% chance of winning the House and more than a 60% chance of winning the Senate, odds that have moved with gasoline prices this year. Equities have historically lagged mildly in the weeks before midterm elections, then converged with non-election years. A US government funding deadline then follows on 11 December.
Several of the risks behind September’s moves (rates, energy and AI valuations) now appear better reflected in prices. The median AI infrastructure stock has de-rated from 32 to 22 times forward earnings since April, and one sell-side estimate puts the saving in global oil spending from a reopening of the Strait of Hormuz at about USD 2 trillion. With diversification across regions, factors and asset classes, we expect our portfolios to remain well placed through a busy run of policy, earnings and political events.
With a comprehensive plan already in place with your Client Adviser, covering near-term spending needs while allocating capital at a level of risk suitable for your longer-term goals, you can have the peace of mind to stay invested for the long term, allowing your wealth to compound and fulfil your ikigai. If you have any questions, please do not hesitate to reach out to your Client Adviser.
The writer of this market review, Glenn Tan, is Senior Portfolio Manager at Providend Ltd, Southeast Asia’s first fee-only comprehensive wealth advisory firm. He is also a CFA Charterholder and a Certified Financial Risk Manager (FRM).
For more related resources, check out:
1. Active Investing That Adds Value to the Client
2. Staying the Course: Investing With Confidence in Uncertain Times
3. Here’s Why We Charge a Higher Fee Than Robos
Download our Investment eBook titled “A More Reliable Way to Get Enough Investment Returns: Even During Times of Market Uncertainty” here.
With a minefield of financial misinformation out there, we promise to be a safe pair of hands and a second pair of eyes to help you avoid costly financial mistakes. Learn more about our investment philosophy here.
We do not charge a fee at the first consultation meeting. If you would like an honest second opinion on your current estate plan, investment portfolio, financial and/or retirement plan, make an appointment with us today.