


Executive Summary
According to a recent Business Times survey conducted earlier this year, more than three in five Singaporeans still prefer to invest in property over stocks and bonds. Property is a tangible and familiar real asset and has been the primary source of wealth accumulation for many Singaporean households. This article examines what property has returned after accounting for the full costs and complexities of ownership, as well as the significant operational realities and legal complications of property ownership, and whether the return on effort justifies the additional complexity over a passive portfolio. While levered property returns have been competitive with financial portfolios over recent periods and in the longer term, returns have been highly path-dependent and driven substantially by idiosyncratic selection and Singapore-specific macro factors such as demographics and government policy. A household that balances property exposure with a diversified global portfolio may improve its probability of reaching its financial goals across a wider range of future outcomes.
Introduction
In recent client conversations, the performance of Singapore’s property market has been a recurring topic. With private residential prices climbing for several consecutive quarters and over the past few years, investors are asking whether their wealth would be better deployed in property, an asset class they know well, rather than in financial portfolios.
Property has generated substantial wealth for Singaporean households over the past three decades. My colleague Chin Yu wrote about this topic in 2023, outlining how property should fit into a portfolio. Since then, private property prices have continued to rise. With the market now entering a phase of moderating price growth, rising vacancy, and an expanding supply pipeline, it is worth revisiting the question with updated data.
This article extends that earlier discussion, using 35 years of URA price index data, cost-inclusive scenario analysis, and a factor regression framework.
Singapore Property Returns Over the Long Term
The URA Property Price Index (PPI) tracks quarterly price movements across three categories of private residential property: all private, landed, and non-landed. It is a hedonic index that adjusts for changes in the mix of transacted properties. Separately, the HDB Resale Price Index tracks the public housing resale market. Together, these indices provide the longest continuous dataset available for assessing Singapore property returns.
Exhibit 1: URA Property Price Index, residential (1975 to 2025)
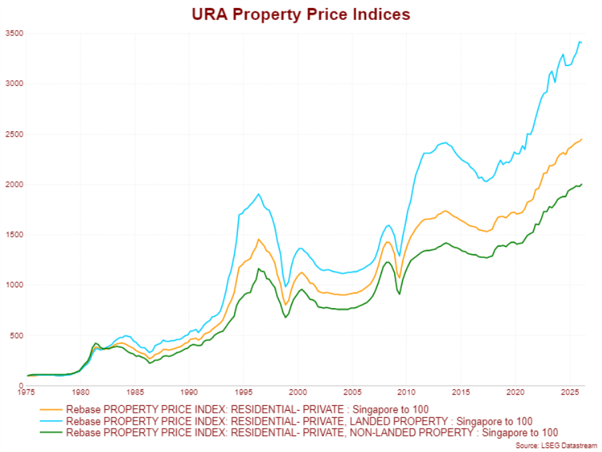
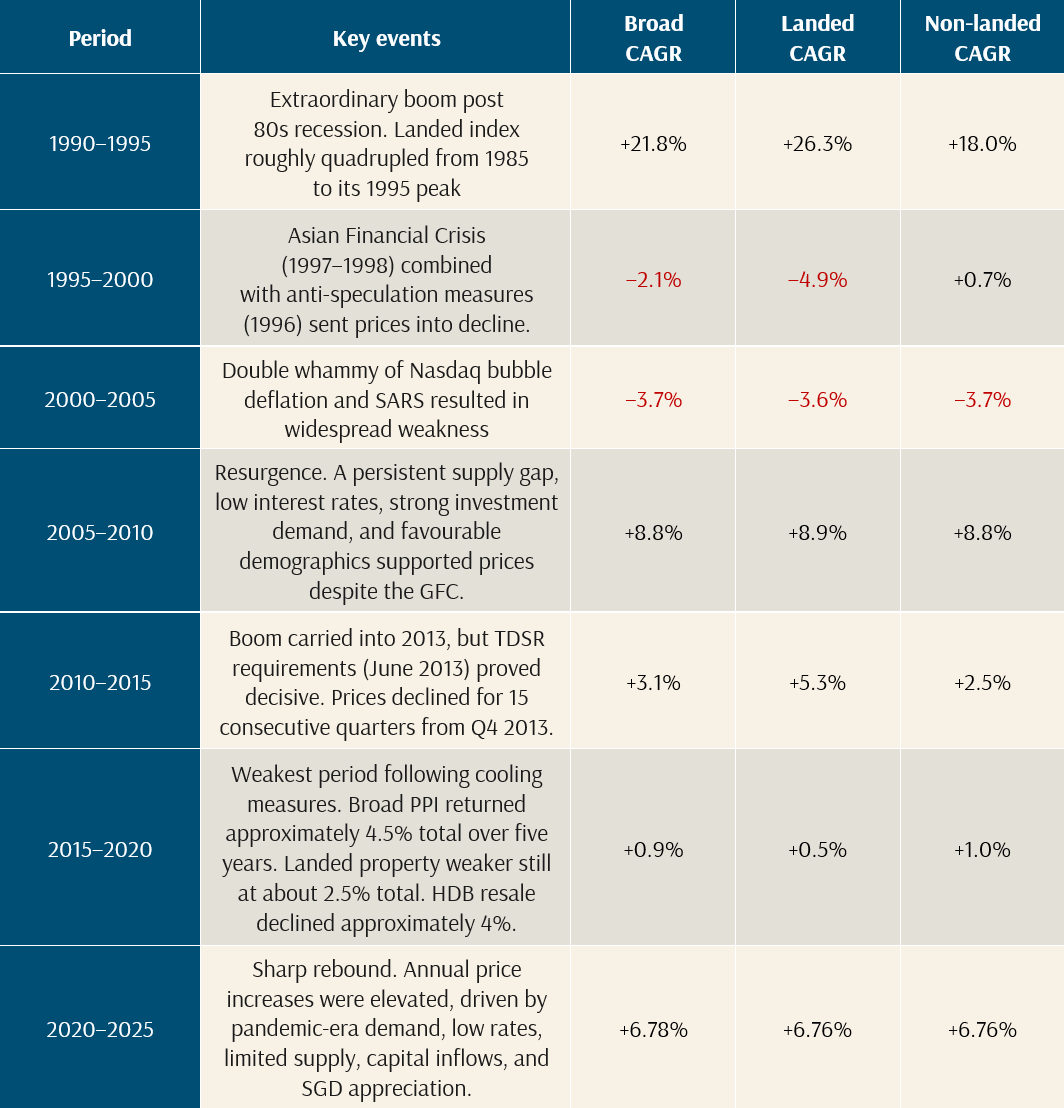
Over the full 35-year period from 1990 to 2025, the broad private property index delivered a compounded annual growth rate of 4.8%, landed property 5.2%, non-landed 4.6%, and HDB resale 6.2%. These returns compare favourably with MSCI All Country World Index in SGD terms at 4.8% over the same period, with the caveat that the first three years of the study period (1990 to 1993) captured an extraordinary property boom, with the landed property index roughly doubling in value, returning an astounding 21.8% CAGR over the 1990-1995 period.
Exhibit 2: Long-term property and equity index returns (1990 to 2025)
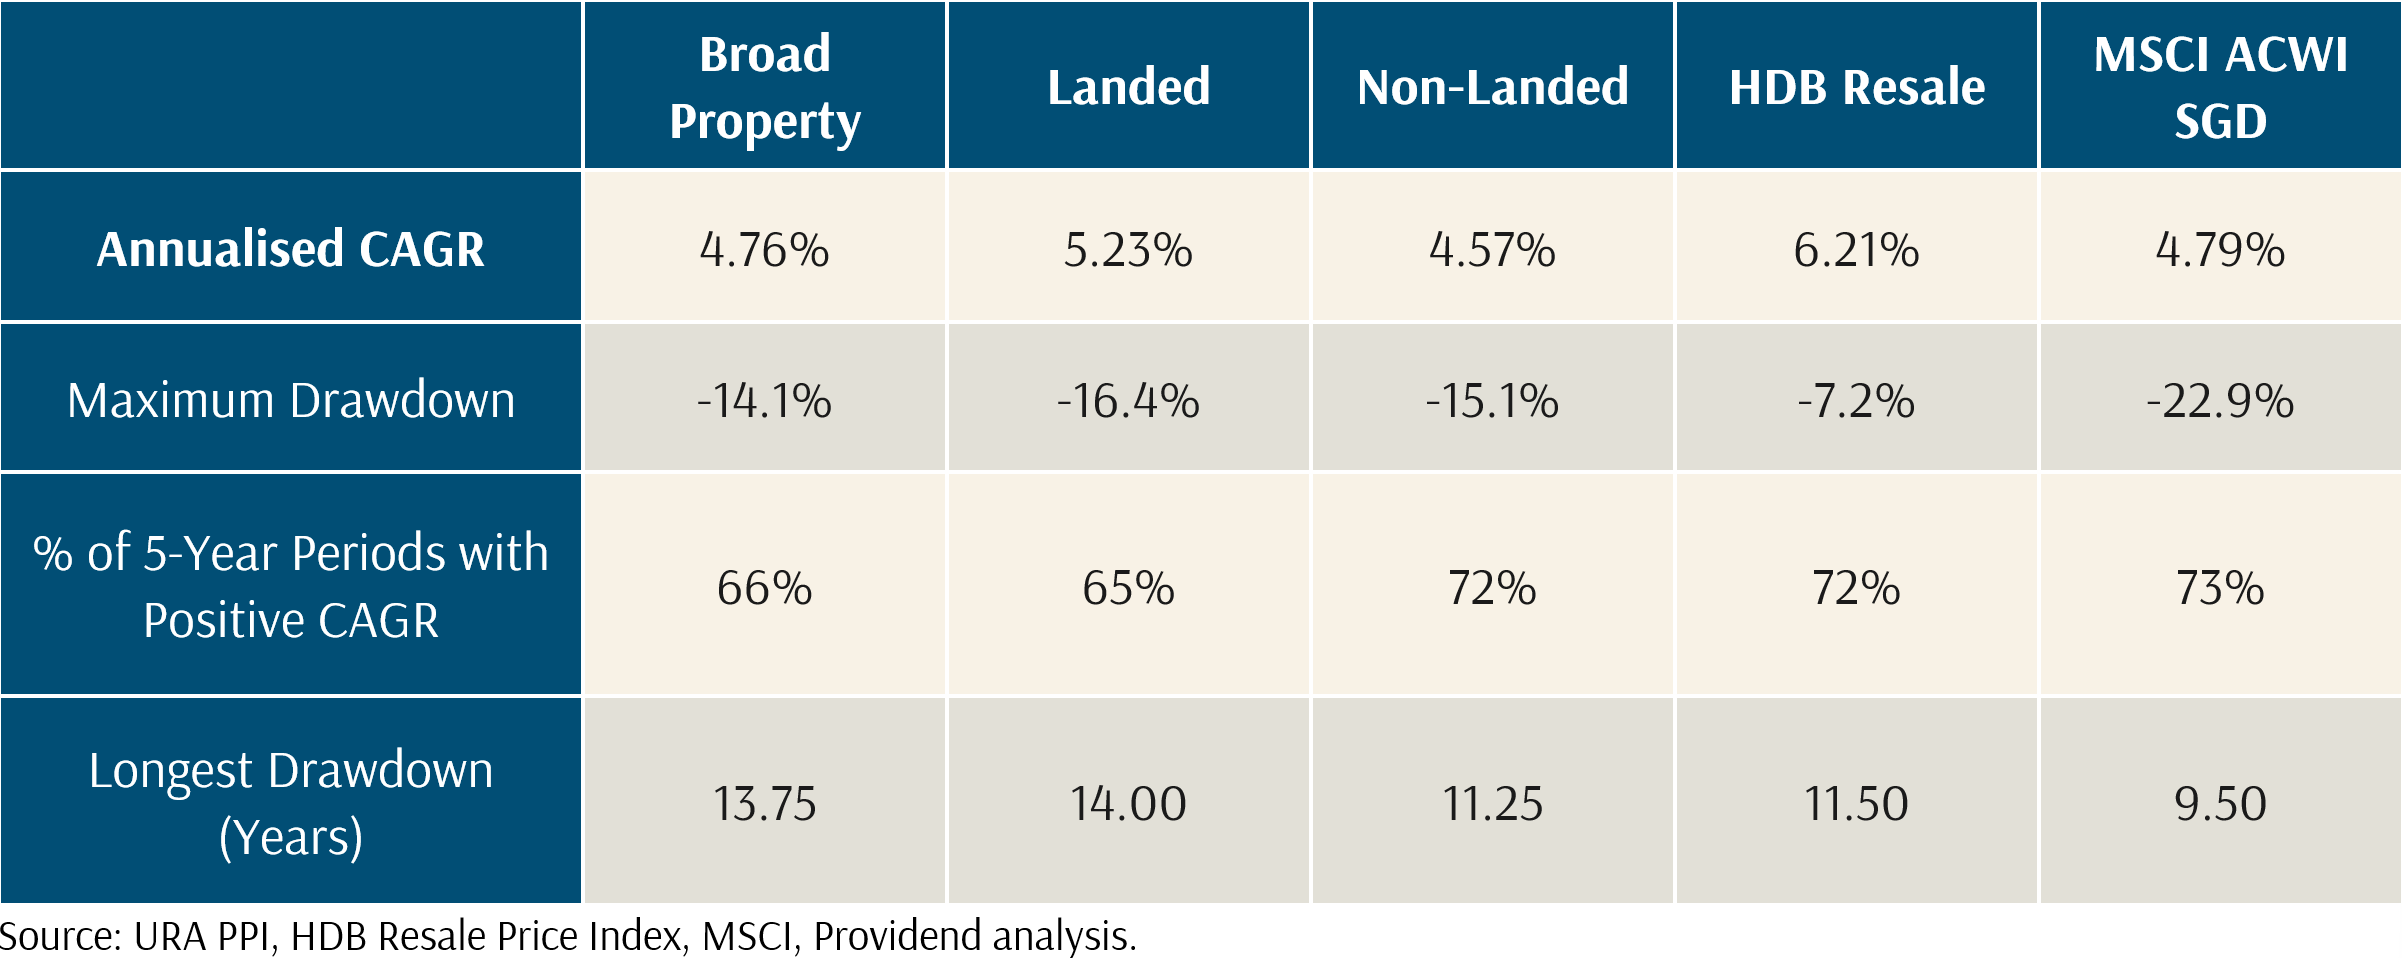
Importantly, there is a difference between what these indices measure and what individual property investors experience. The PPI is a statistical aggregate that one cannot directly invest in. An individual property is subject to specific risks that the index abstracts away, including location, lease tenure and run-down, fixed asset depreciation, physical condition, and the particular supply-demand dynamics of its micro-market. Hence, over the investment lifetime, an individual property’s returns will deviate from the headline index in either direction.
Next, we provide a synopsis of the complete trajectory of the Singapore property market over the past 35 years. Breaking this period into five-year blocks, we examine returns in each intervening period and recap the corresponding major events which drove these returns.
Timeline of Events and Corresponding Returns
Exhibit 3: Timeline of key events and corresponding property returns (1990 to 2025)
The Real Experience of Property as an Investment
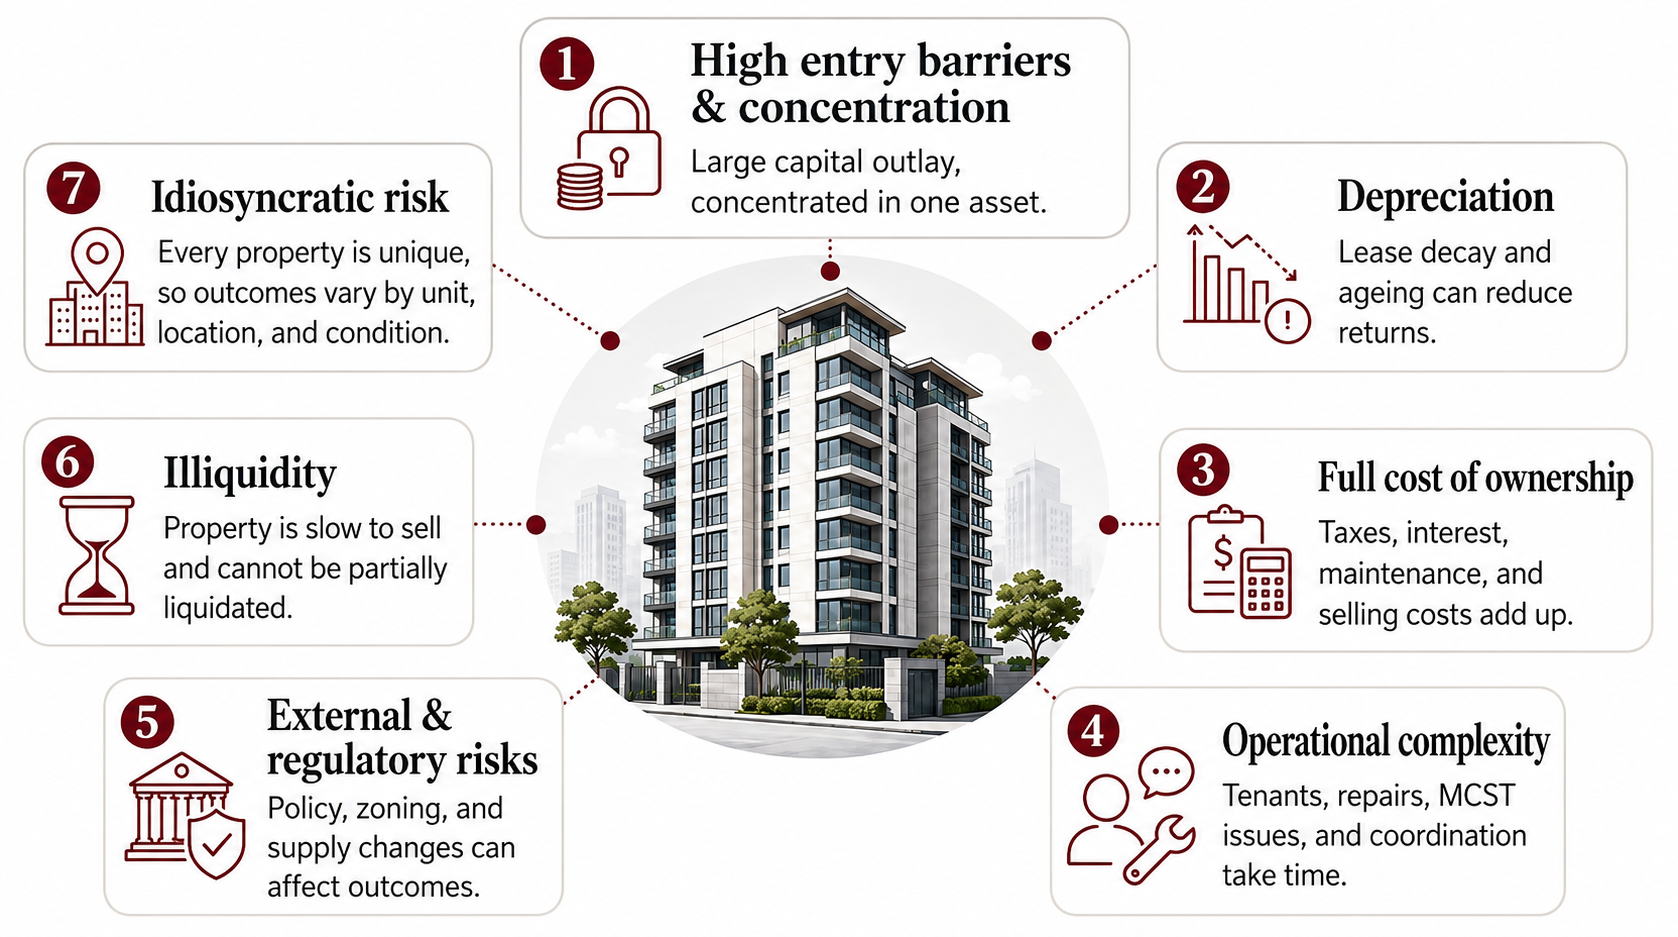
The headline returns presented above are index-level figures. To estimate what an individual property investor actually earns, we need to account for the layers of cost and complexity that sit between the index return and the investor’s net outcome. Some of these are directly quantifiable, such as stamp duties, mortgage interest, property tax, and renovation expenditure. Others are less tangible yet just as consequential. These include the operational burden of tenant management, the governance friction of collective ownership, and the exposure to external developments outside the investor’s control.
Exhibit 4: The principal risks of direct property investment
High Entry Barriers and Concentration
The entry ticket for a non-landed private property in Singapore, one with sufficient size and lease tenure to approximate the broad index, currently sits at approximately in the range of $1.9 million to $2.1 million for a three-bedroom unit in the Outside Central Region. Landed property starts at approximately $3.5 million to $4 million.
Diversification within the property asset class is generally constrained by the Additional Buyer’s Stamp Duty (ABSD) regime. A Singapore citizen purchasing a second residential property currently faces 20% ABSD, rising to 30% for a third property. For permanent residents and foreigners, the rates are even higher. These duties are punitive and effectively prevent most investors from building a diversified portfolio of local properties without deliberate ownership strategies planned well in advance.
Depreciation
The URA PPI measures price changes in the market for transacted properties, but it does not capture the depreciation that affects an individual property over its holding period. This depreciation takes two forms.
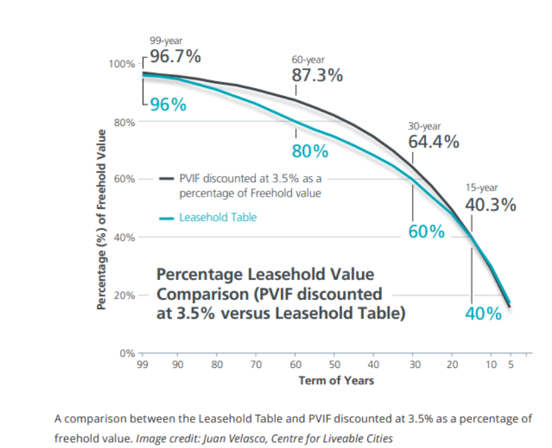
The first is leasehold run-down. The majority of private condominiums in Singapore are built on 99-year leases. As the remaining lease shortens, the property’s value is affected in ways that accelerate over time. Exhibit 5 below shows a lease depreciation schedule commonly used by the Singapore Land Authority (SLA) and other authorities.
On a practical level, a property with 70 years remaining is viewed quite differently by the market from one with 50 or 40 years remaining. Below 60 years, many banks will restrict loan tenure or reduce the quantum available, constraining the pool of eligible buyers. Below 30 years, financing becomes difficult and the property’s value converges towards the land’s residual worth, which for leasehold properties is zero at lease expiry. An investor holding a 99-year leasehold property for 20 to 25 years may find that while the broad price index has risen over that period, their individual unit has appreciated less, or even declined, because the lease has shortened from 90 years to 65 or 70 years.
Exhibit 5: “Bala’s” table and PVIF method for determining leasehold value as percent of freehold value
The second form of depreciation is physical. A 20-year-old condominium with weathered facades, ageing plumbing, and dated finishes competes for buyers against newer developments, and the gap widens with each passing year. Landed properties face a similar drag through roofing, structural repairs, pest control, garden upkeep, and periodic renovations. These costs accumulate over the holding period and reduce the net return that the owner actually receives.
Other Costs of Ownership
Property returns are often discussed in terms of capital appreciation alone. The actual cost of owning a property over a typical holding period includes a longer list of items: Buyer’s Stamp Duty on acquisition, mortgage interest over the holding period, annual property tax (which grows as assessed values increase), renovation and maintenance costs, management and sinking fund fees for condominiums, agent commissions on sale, and legal fees for both entry and exit.
For investment properties where rental income is earned, the gross yield should be weighed against vacancy risk, tenant management costs, income tax on rental proceeds, and any additional ABSD payable on acquisition. Accordingly, net rental yields in Singapore for private condominiums typically sit in the range of 2.5% to 3.5%, which is below the gross figures commonly cited.
Operational Complexity
Owning an investment property is, in many respects, running a small business.
Exhibit 6: The operational demands of owning an investment property

Tenant management is a recurring operational demand. Finding tenants, vetting them, negotiating leases, managing move-ins and move-outs, handling maintenance requests, and dealing with disputes all require time and attention. A difficult tenant, whether through late payment, property damage, or breach of lease terms, can impose costs that extend well beyond the financial. Legal proceedings, renovation between tenancies, and periods of vacancy also play a part. Even with a property agent managing the tenancy, the landlord remains ultimately responsible for decisions and costs.
For condominium owners, the management corporation (MCST) introduces a layer of collective governance. MCST decisions on maintenance spending, sinking fund contributions, upgrading works, and facility management affect both the quality of the living environment and the ongoing cost of ownership. Disputes within management corporations, whether over budgets, maintenance standards, or special levies, are common and can affect property values if the development becomes poorly maintained or embroiled in litigation. The quality of MCST management varies widely across developments.
For landed property owners, the operational burden is also heavy and is entirely borne by the owner alone, unlike in a condominium development. The owner bears direct responsibility for all maintenance, from structural repairs to drainage, fencing, and pest management. There is no MCST to fall back on, and the costs and coordination of major repairs, such as roofing, foundation issues, boundary disputes with neighbours, fall entirely on the owner.
Additionally, the cost of repair, restoration, and renovation works has risen well ahead of general inflation. Construction labour costs in Singapore have increased considerably over the past decade, driven by foreign worker levies, tighter quota policies, and a structural shortage of skilled tradespeople. Building materials, from concrete and steel to imported fittings and fixtures, are subject to global commodity cycles and supply chain disruptions. An owner who budgets $150,000 for renovation in 2025 may find that the same scope of work costs $200,000 or more by 2030.
The ownership experience can also be altered by factors as personal and unpredictable as a change of neighbour. A new occupant in an adjacent unit or next door, whether a noisy tenant, a family with different living standards, or a neighbour who undertakes prolonged renovation works, can change the quality of the living environment and, in some cases, affect the property’s attractiveness to future buyers or tenants.
External Risks
Property values are also exposed to external developments that are generally out of the control of the owner. Changes in government zoning, new infrastructure projects, and shifts in the surrounding built environment can enhance or diminish value in ways that are unpredictable.
A new MRT line or station can lift values in nearby areas, but the reverse is also true. A new expressway, an industrial development, or a large-scale construction project adjacent to a residential property can negatively affect both liveability and resale value. For example, while owners who put up with MRT construction for half a decade will eventually be rewarded with an excellent value uplift, owners who have done the same for the projects like the North-South Corridor may experience all the grief but little of the reward.
New Government Land Sales (GLS) sites in the vicinity introduce competing supply that may weigh on prices and rental demand. Changes to land use planning, such as rezoning or adjustments to plot ratios in neighbouring parcels, can alter the character of a neighbourhood over a holding period.
For condominium owners, the possibility of an en bloc (collective sale) adds a layer of uncertainty. While an en bloc can be financially attractive for owners who receive above-market compensation, the process is disruptive, often protracted, and creates a period of uncertainty during which the property is difficult to sell or lease on normal terms. Owners who do not wish to sell at the offered price may find themselves bound by a collective decision if the requisite consent thresholds (80% for developments over 10 years old) are met.
Regulatory risk increases as property prices grow. The history of Singapore’s property market is one of active government intervention. Cooling measures, ABSD adjustments, LTV limits, TDSR requirements, and property tax rate changes have all been used at various points to manage the market. These policy tools can shift significantly between the time of purchase and the time of sale, altering the economics of an investment in ways that were not foreseeable at the point of entry. An investor who bought a property in 2010 with a view to purchasing a second in 2015 faced a very different ABSD and TDSR landscape from the one they had planned for.
Illiquidity
Property, as an asset, is comparatively illiquid. A typical sale takes three to six months from listing to completion and is contingent on finding a willing buyer at an acceptable price. Property cannot be partially liquidated. An investor who needs $200,000 for an unexpected expense cannot sell a bedroom. Their options are to refinance (subject to bank approval and TDSR limits), take a personal loan, or sell the entire property. This constraint is consequential for retirement planning, where the ability to draw down wealth incrementally over time is central to the wealth plan. It also affects estate settlement, where beneficiaries may need to sell the property at whatever price the market offers at the time.
Idiosyncratic Risk
Every property is unique. Two apartments in the same development can have different outcomes depending on floor, facing, view, lease expiry, and condition. This idiosyncratic risk is largely undiversifiable given the ABSD constraints discussed above. An investor holding a single property is highly exposed to risks specific to that asset.
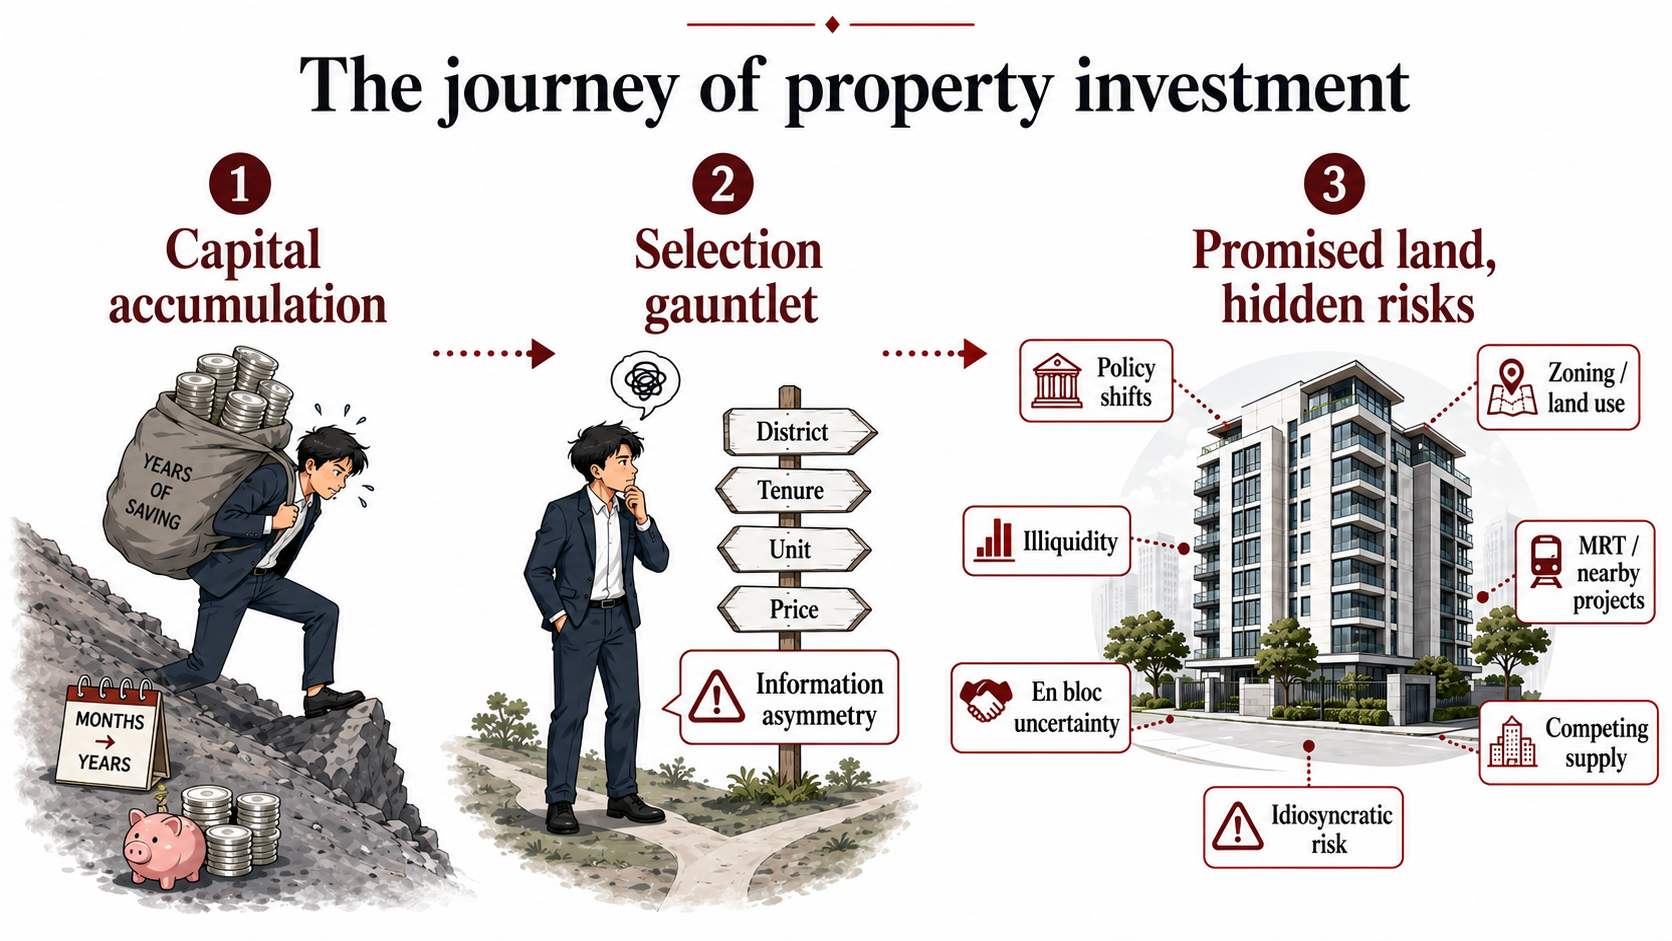
Assessing these risks correctly is difficult in practice. Individual investors often approach property decisions with strong personal preferences, whether for a particular district, a specific development they have lived near, or a property type they are familiar with. These preferences can colour the analysis and lead to decisions driven more by comfort than by return potential. Investors may also rely on property agents for guidance, yet agents earn commissions on transactions and may have a financial interest in seeing deals close. The advice an investor receives is not always aligned with their long-term financial interest, and the asymmetry of information between the agent and the buyer makes it difficult for the average purchaser to evaluate independently whether a particular property at a given price represents a sound deployment of capital.
Exhibit 7: The journey of property investment, from capital accumulation to hidden risks
Scenario Analysis of Cost-Adjusted Returns
The analysis that follows applies most directly to Singaporeans who already own residential property in Singapore and are considering how to channel their available investment funds, as this is the most typical profile among our clients. We model three scenarios that represent common decisions facing these owners, comparing property returns against a diversified global equity portfolio with all costs, rental income, and leverage explicitly accounted for over a 15-year holding period. Unlike index-level comparisons, which omit rental income and therefore understate property returns, these scenarios reflect what owners actually experience.
All return assumptions are measured over a common window, from September 2017 to the latest available quarter (Q1 2026). Property CAGRs use URA PPI data over this period (non-landed: 5.43%, landed: 6.13%), while the portfolio return uses Index Plus Equity SGD since inception over the same window (9.41%). This like-for-like timeframe ensures that each scenario is evaluated against the same market environment.
Common Starting Position
The investor owns a 4-room freehold condominium valued at $4 million with an existing mortgage at 45% LTV ($1.8 million outstanding, 2.5% interest rate, 25-year tenure). They have $1 million of additional equity to deploy. The monthly mortgage payment on the existing condo is $8,075. The question is how best to use the $1 million.
Baseline: Condo Plus Diversified Portfolio
The investor retains their existing home and invests the additional equity in a diversified global equity portfolio. The condo appreciates at the non-landed PPI CAGR of 5.43%. The portfolio grows at 9.41% (Index Plus Equity SGD since inception, September 2017).
Exhibit 8: Baseline cost schedule (15-year)
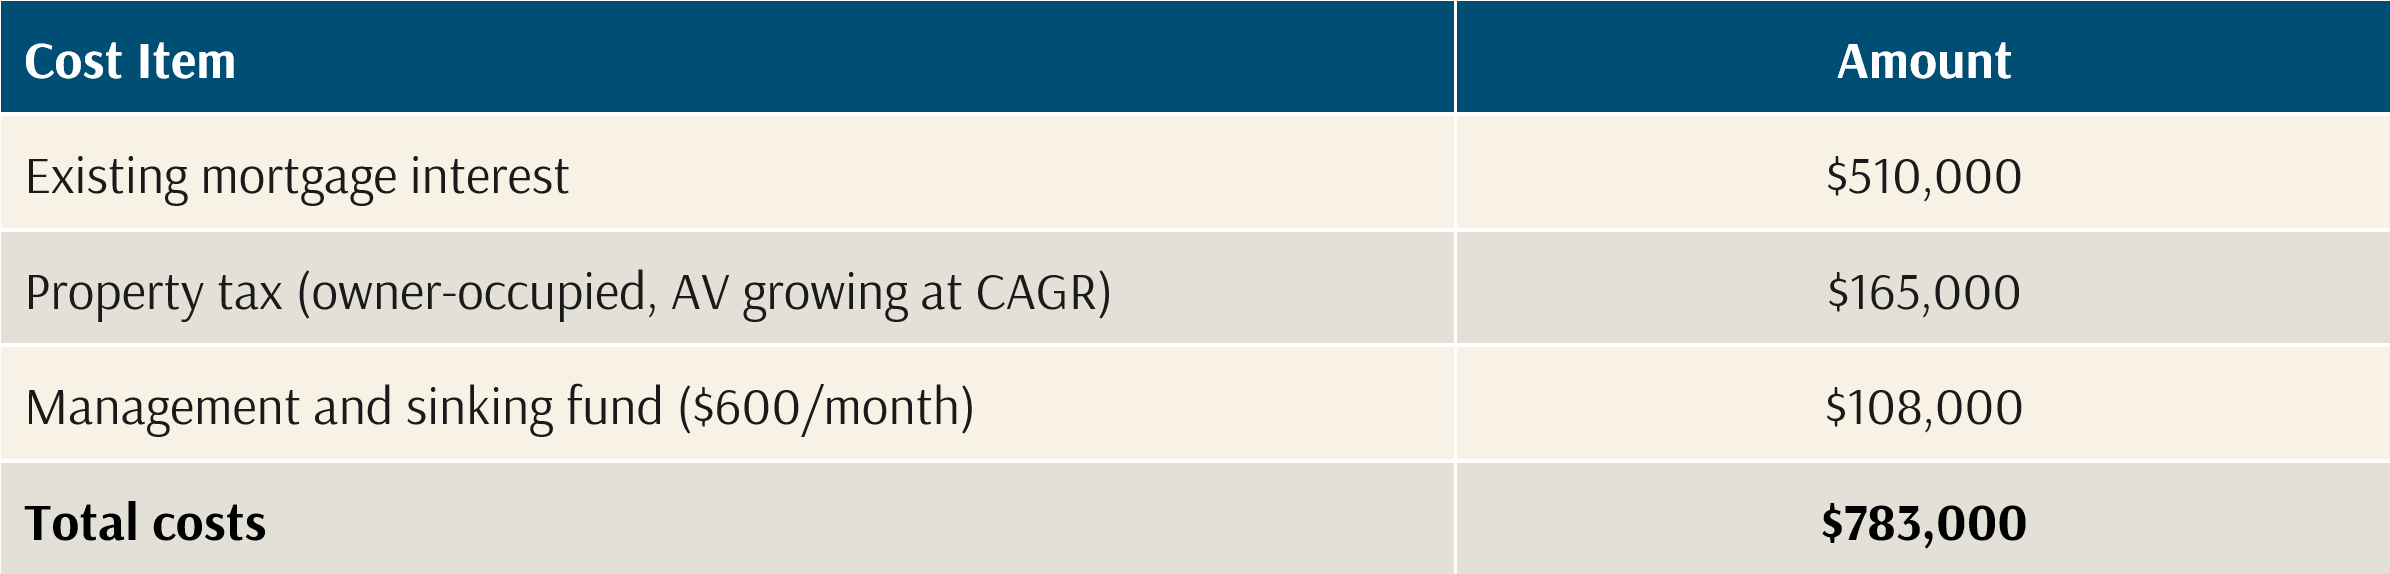
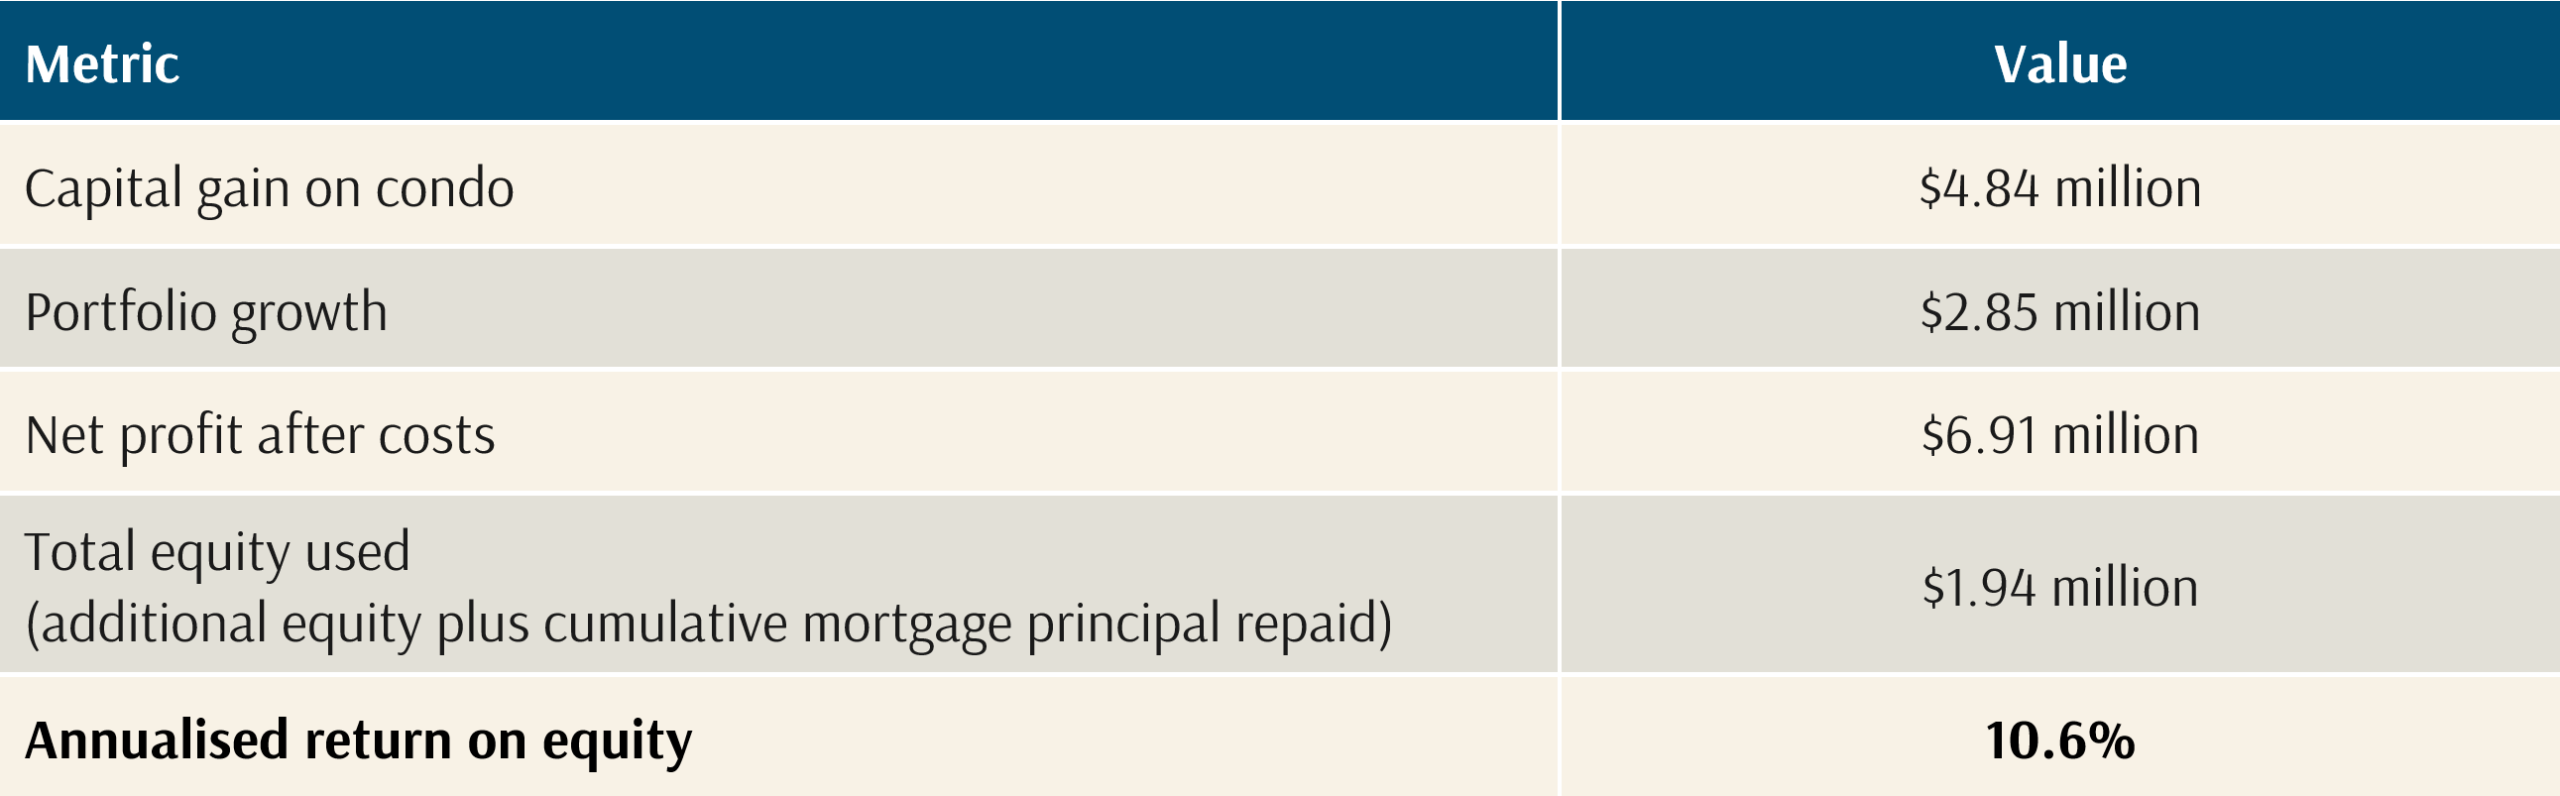
Exhibit 9: Baseline outcome metrics (15-year)
Scenario A: Upgrade to a Landed Property
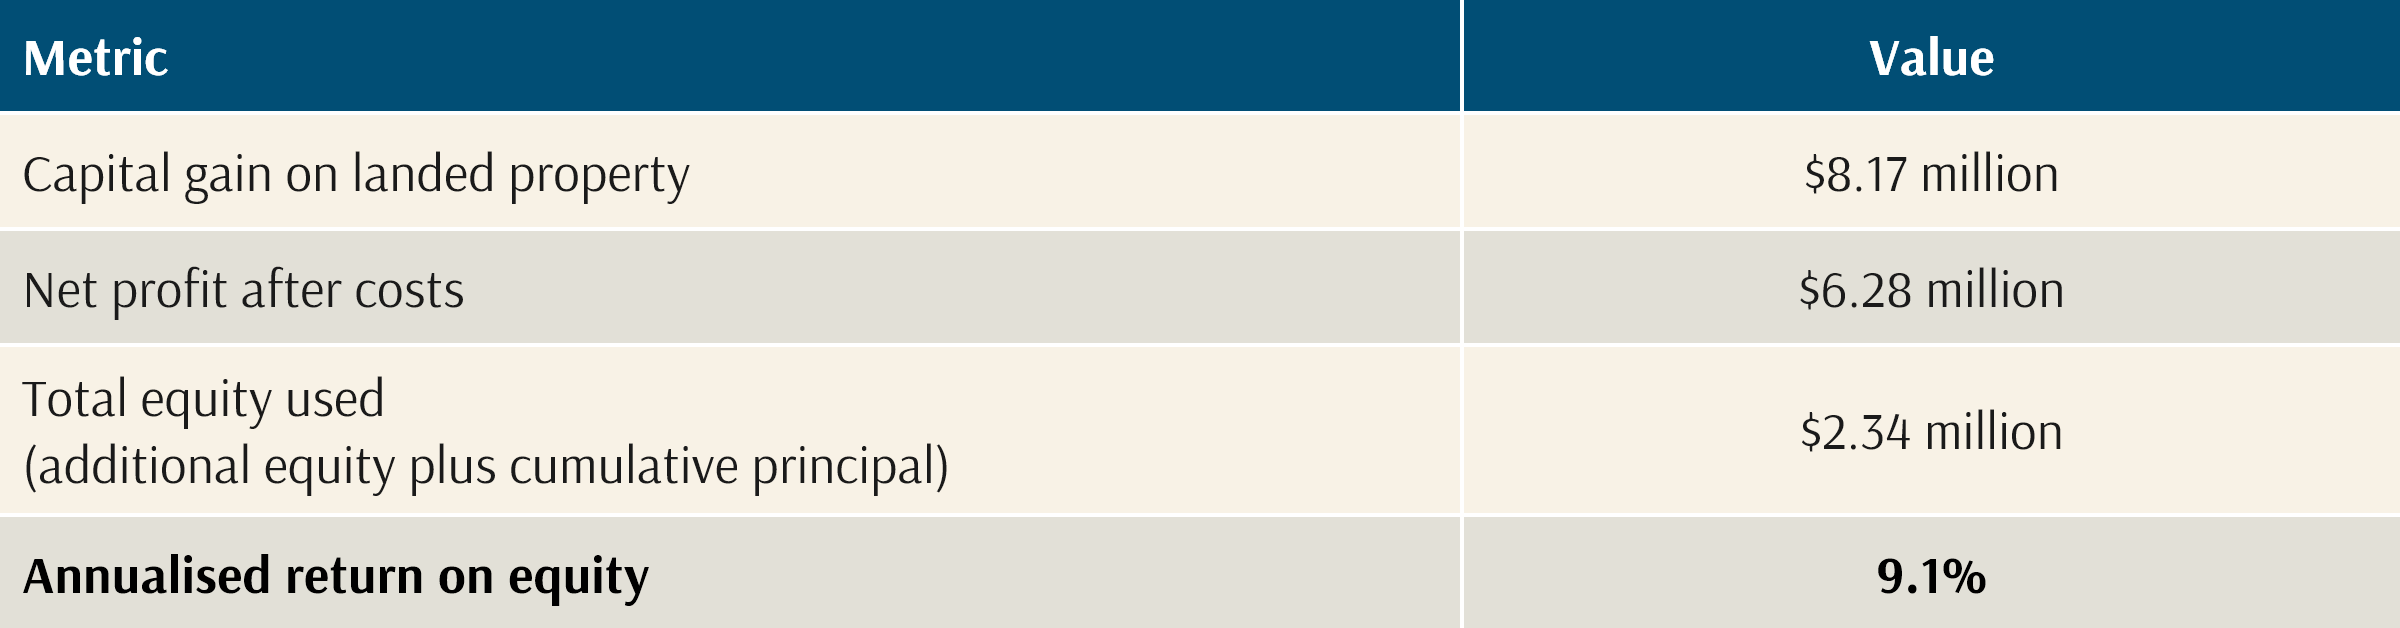
The investor sells the existing condo, repays the outstanding mortgage, and uses the net proceeds plus $1 million of additional equity to purchase a $5.67 million landed property at 45% LTV ($2.55 million mortgage).
Exhibit 10: Scenario A cost schedule (15-year)
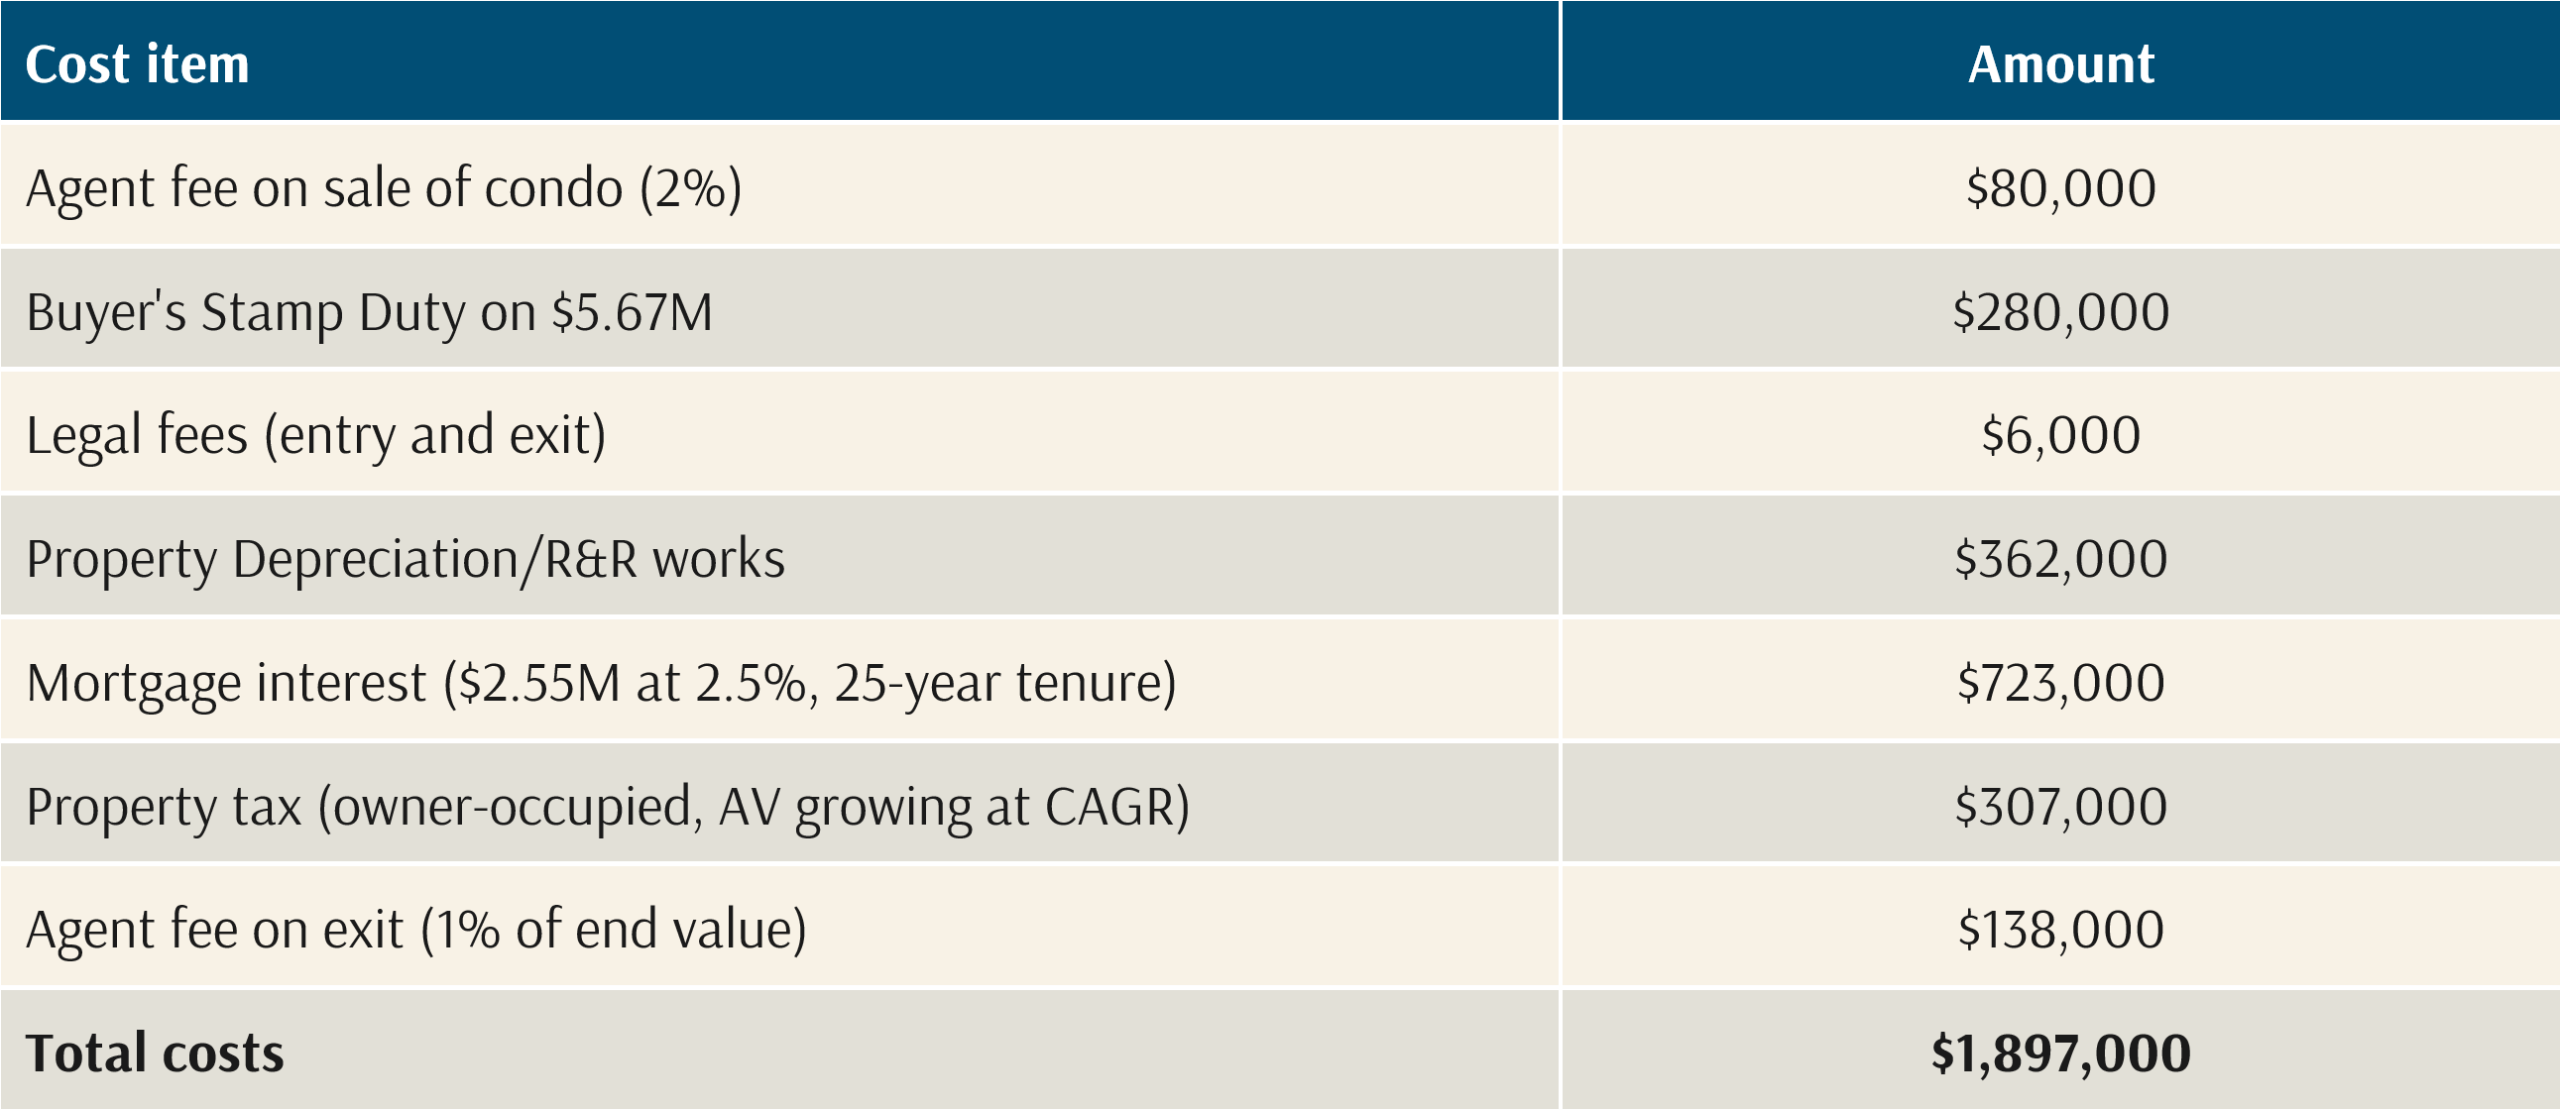
Exhibit 11: Scenario A outcome metrics (15-year)
Scenario B: investment condo
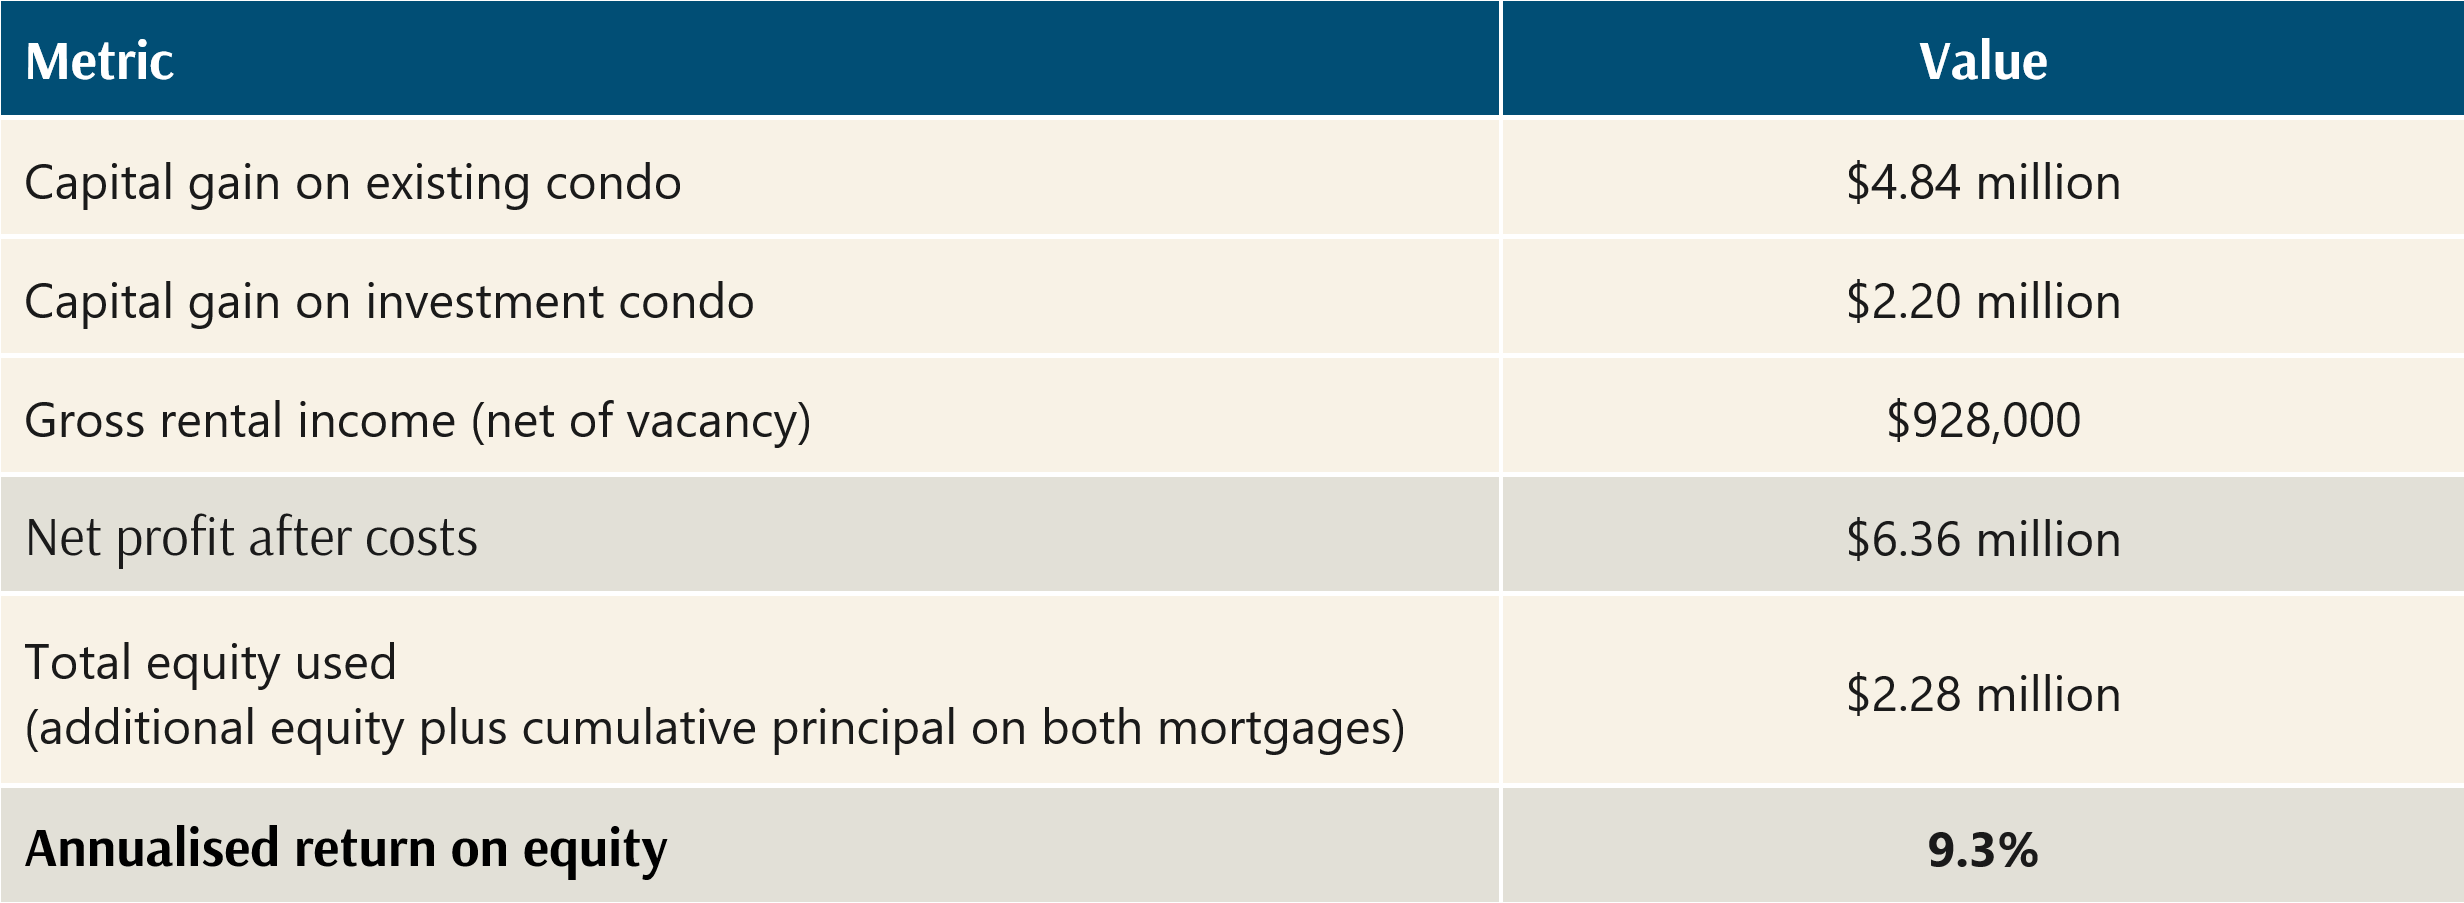
The investor retains the existing home and purchases a $1.82 million investment condominium at 45% LTV ($818,000 mortgage). The property is held under a family member’s name. Rental yield is assumed at 3.5% gross with approximately five months of vacancy over the holding period. For simplicity, the scenario assumes the purchase of a freehold condominium, which avoids modelling leasehold run-down, as well as no tax on net rental income.
Exhibit 12: Scenario B cost schedule (15-year).
All costs depicted are cumulative over the 15-year horizon.
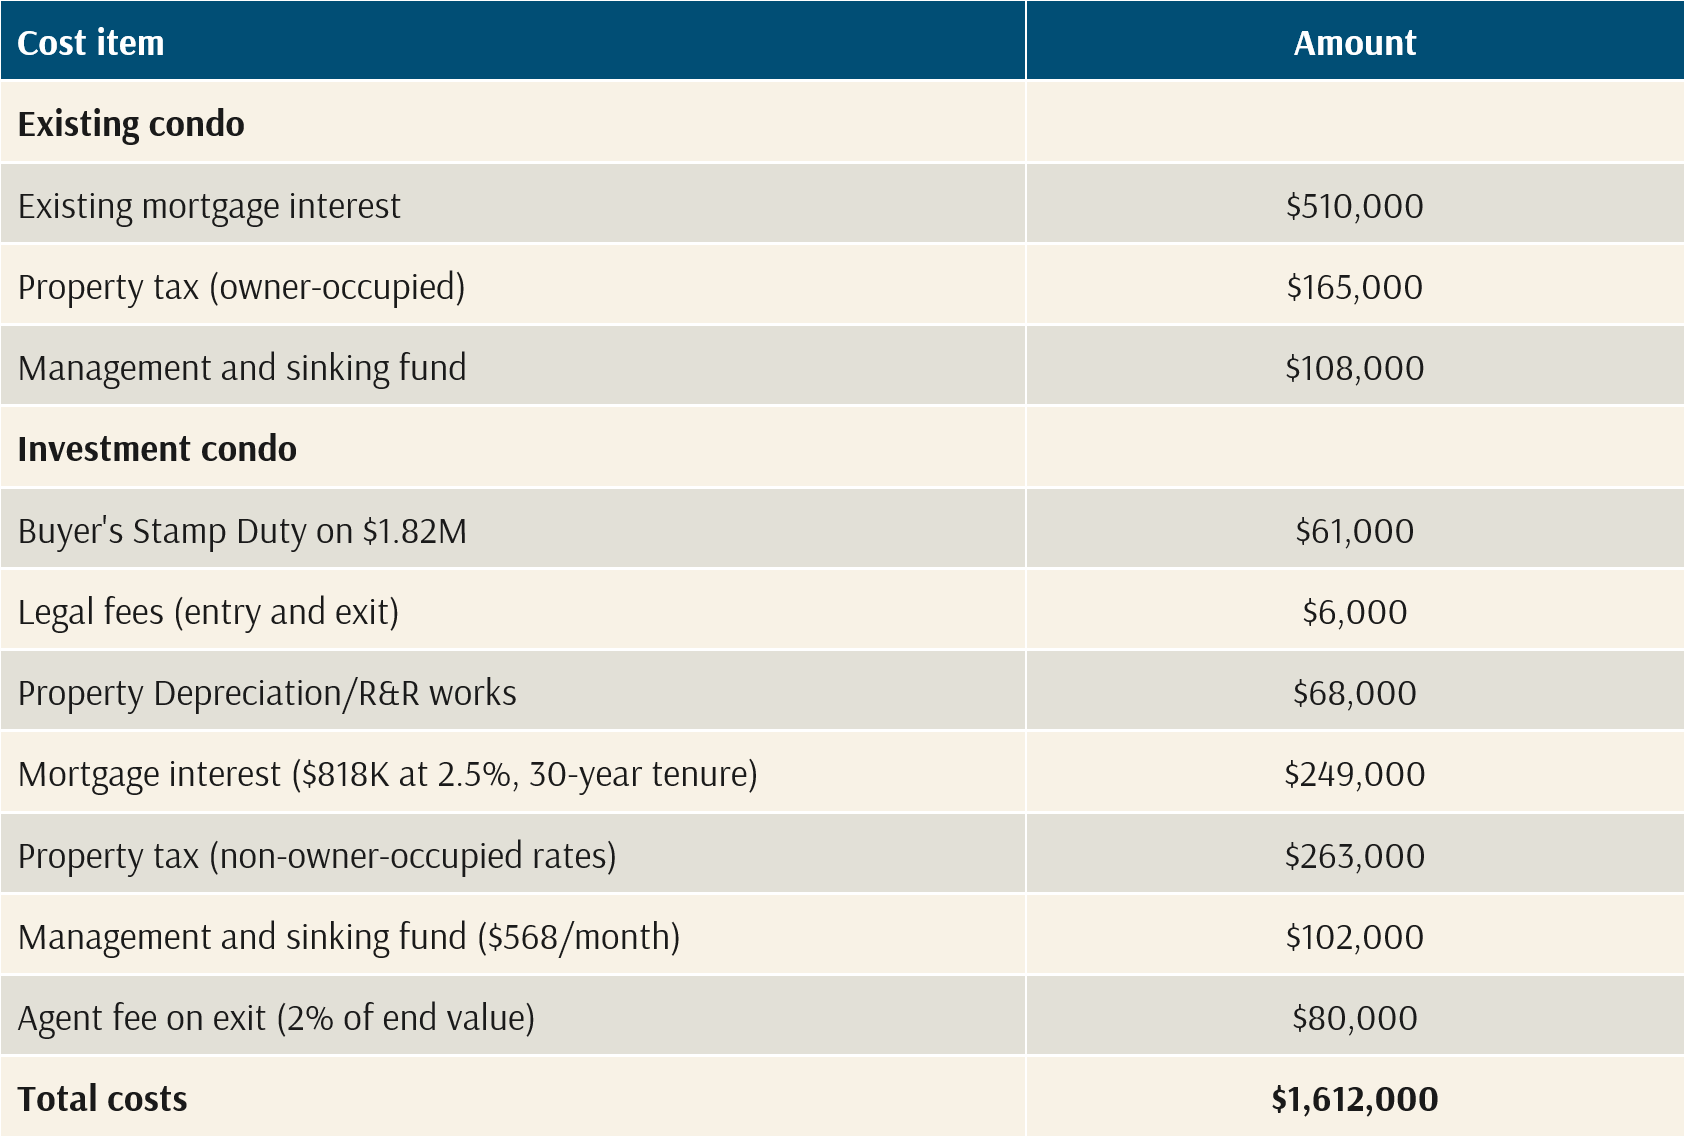
Exhibit 13: Scenario B outcome metrics (15-year)
Comparison
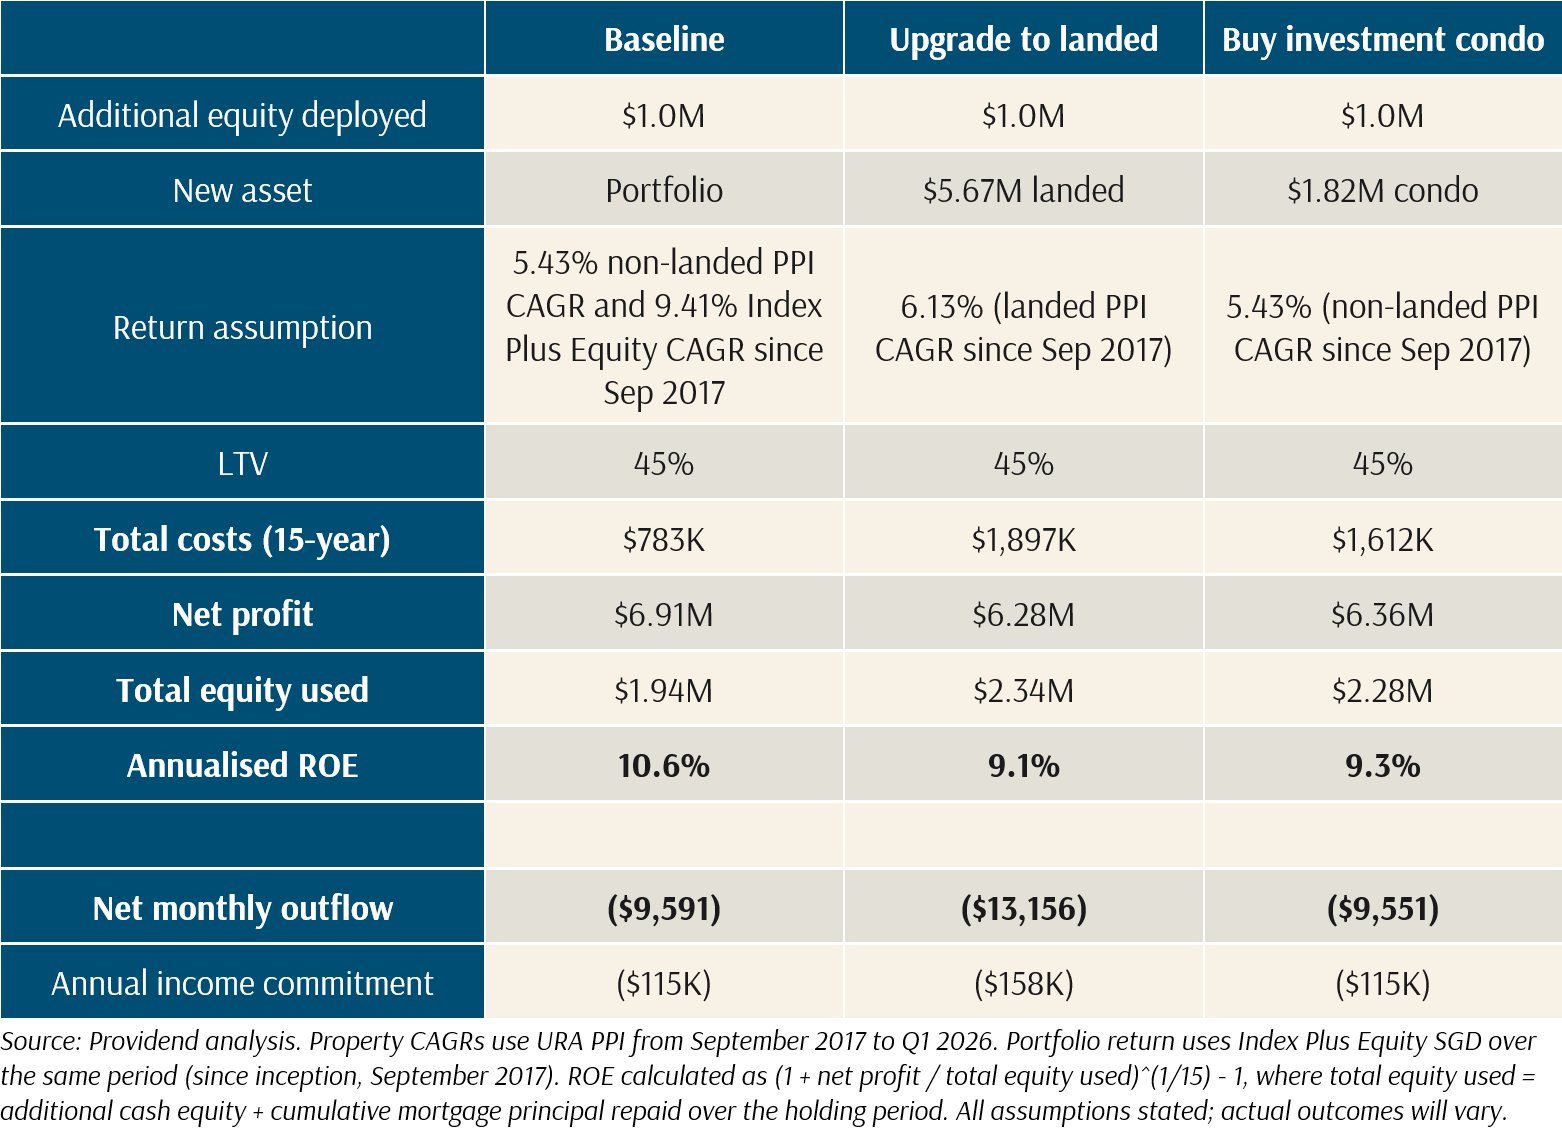
Exhibit 14: Scenario comparison over a 15-year holding period
Observations
The baseline scenario (remaining in current condo and investing available capital in a diversified portfolio) produces the highest net profit and annualised return on equity, despite requiring the lowest incremental complexity. The landed upgrade generates the largest headline capital gain but also carries the highest total cost and income commitment. The investment condo scenario is more competitive because rental income offsets part of the carrying cost, but it still introduces a second set of property taxes, maintenance costs, tenancy risk, and financing obligations.
Leverage
All three scenarios use 45% LTV. Under MAS rules, borrowers with an existing housing loan face a maximum LTV of 45%, and since all three scenarios model an investor who already owns a mortgaged property, 45% represents the regulatory ceiling. Even though a first-property buyer could technically access 75% LTV, the 55% TDSR cap on total debt servicing relative to gross income means that most households carrying an existing mortgage cannot realistically borrow more. A 45% LTV reflects the leverage ratio most investors in this position would actually carry.
Leverage amplifies both returns and risk. In a rising market, the investor’s equity captures the full price movement of the underlying asset. A 6.13% annual appreciation on a $5.67 million landed property becomes a higher return on the $3.12 million of equity invested. Conversely, the same arithmetic works in reverse. If the property declines by 10% over a multi-year period, which has occurred in Singapore (the broad PPI fell approximately 12% from its 2013 peak to its 2017 trough), the equity absorbs the full loss while mortgage payments continue regardless. For an investment property, vacancy during a downturn compounds the cash flow pressure, as the investor must service the mortgage from other income while the asset is declining in value.
Return on Effort Versus Return on Equity
The preceding analysis focuses on financial returns, but financial returns tell only part of the story. Property investment demands a level of ongoing operational involvement, from tenancy management to maintenance coordination, tax filing, and mortgage servicing, that a portfolio of financial assets doesn’t. Accordingly, it is worth extending the return-on-equity framework to account for return on effort.
For older investors, leveraged property investment also means that financial pressure is exacerbated by shorter available loan tenures. A borrower aged 55 taking on a $2 million mortgage may be limited to a 10 or 15-year term, resulting in monthly repayments that consume a far larger share of household income than the same loan spread over 25 years. This results in a somewhat ironic situation in which wealth accumulated through a career of saving and investing, rather than reducing financial stress, is redirected into a leveraged obligation that demands ongoing income to sustain. For many, this may be the opposite of what growing wealth was supposed to achieve.
Legal complexity
Investors who aim to optimise property returns face additional complexity. As recently highlighted in a Straits Times article, structuring ownership across partners and family members using arrangements such as 99-to-1 ownership splits or decoupling titles, involves legal costs, potential stamp duty implications and long-tail risks. These strategies may be common in the Singapore market, but the costs they impose on participants are often not apparent at the outset and can add up over time.
Costs may extend beyond financial considerations. For example, a spouse holding title on behalf of the family may have their borrowing capacity constrained for years. A parent transferring ownership to a child may create estate planning complications that surface only much later, impact his or her ability to purchase public housing, and limit their individual borrowing capacity. Beyond individual participants, these structures can strain relationships and create resentments and dependencies that persist well beyond the original investment decision. A financial arrangement that seemingly optimises returns may have an opposite impact on familial relationships.
Property Return Drivers and Outlook
Understanding what has driven property returns in the past is necessary for forming a view on what may drive them in the future.
Factor Analysis
A simple regression of quarterly broad property index returns against three macro variables, STI returns, GDP growth, and changes in SGD interest rates, yields an R-squared of 0.37. This means that these commonly cited macro factors explain roughly 37% of property return variation. Accordingly, the remaining 63% is attributable to factors not captured by the model.
Exhibit 15: Regression results, quarterly broad property index returns
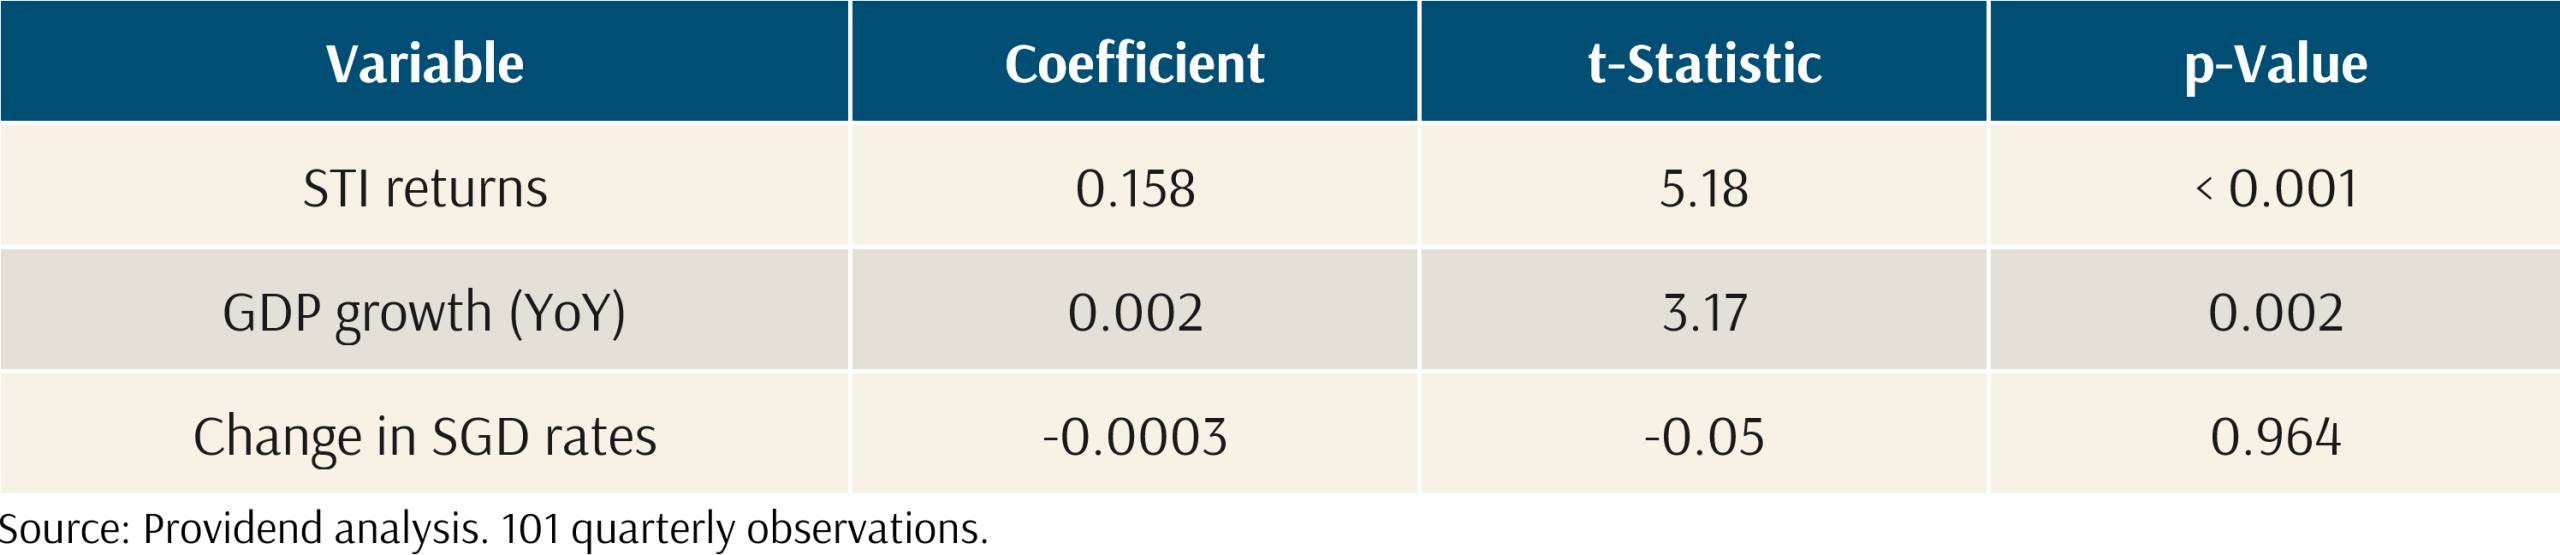
STI returns and GDP growth are highly statistically significant drivers. The change in interest rates, by contrast, is not a statistically significant factor. Hence, this challenges a common assumption in the market: that falling interest rates should be straightforwardly positive for property prices. The data suggest that rate movements alone, without accompanying positive GDP growth and equity market returns, have historically had little explanatory power for property returns.
Academic research also supports the finding that Singapore property returns are driven substantially by idiosyncratic, Singapore-specific factors. In an academic paper, Chia, Li, and Tang (2017) found that fundamental factors, principally demographic changes and land supply, explained 47% of public housing price growth and 81% of private housing price growth from 1980 to 2015. Demographics contributed the most to both public and private housing price increases over this period.
Forward-Looking Considerations for Key Return Drivers
If demographics and government policy have been the two most important idiosyncratic drivers of property returns, investors should consider where these factors stand today.
On demographics, the picture has changed. Singapore’s total fertility rate fell to 0.87 in 2025, a record low and a decline from 1.24 just a decade earlier. Resident births in 2025 were the lowest in Singapore’s recorded history, at approximately 27,500. The proportion of citizens aged 65 and above reached 20.7% in 2025, up from 13.1% a decade earlier. Deputy Prime Minister Gan Kim Yong warned in Parliament that without new measures, the citizen population will begin to shrink by the early 2040s. Despite this, immigration has partially offset these trends, pushing the total population from 4 million in 2000 to 6.1 million today, but the rate of citizen population growth has slowed from 0.9% per year (2015 to 2020) to 0.8% per year (2020 to 2025).
Exhibit 16: Singapore demographics, total fertility rate and population ageing (2005 to 2025)
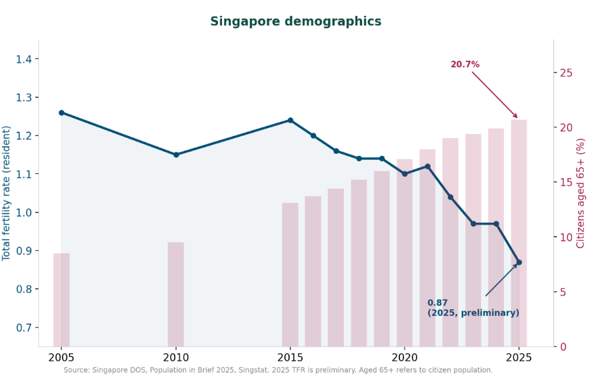
While immigration policy remains a lever the government can adjust, deploying it at the scale required to offset declining domestic household formation demands considerable political capital. Singapore’s experience with the 2013 Population White Paper demonstrated that high immigration targets carry costs in social cohesion, public infrastructure strain, and electoral risk that constrain how aggressively the lever can be pulled. Subsequent policy has been more measured, favouring selective skilled inflows over broad population growth.
With regard to government policy, the current cooling measure regime remains firmly in place. ABSD rates for second and subsequent properties are at historically high levels. TDSR requirements constrain borrowing capacity. The most recent round of SSD adjustments in late 2025 contributed to a deceleration in private property price growth, with Q1 2026 showing a 0.9% quarter-on-quarter increase (revised from the flash estimate of 0.3%), the sixth consecutive quarter of growth but at a moderating pace.
Current Market Signals
Vacancy rates have risen recently. The overall private residential vacancy rate reached 6.2% in Q1 2026, up from 6.0% in Q4 2025. In the Outside Central Region, vacancy rates for private condominiums have risen to approximately 7% to 9%, reflecting the concentration of new completions in suburban areas. This is particularly relevant for investment property buyers targeting rental income.
Consequently, the rental market, after seven consecutive quarters of decline from its early 2023 peak, showed only a marginal 0.3% increase in Q1 2026. Private rental rates in the Rest of the Central Region softened by 1.2% quarter-on-quarter, while the Outside Central Region eked out a 0.5% gain. Net rental yields, after accounting for vacancy, maintenance, and property tax, sit in the range of 2.8% to 3.1% for a typical OCR investment unit. Analysts expect private rents to remain broadly flat or to rise by 0% to 2% through 2026.
Exhibit 17: Growth in upcoming private residential supply by completion year (2023 Q4 to 2026 Q1)
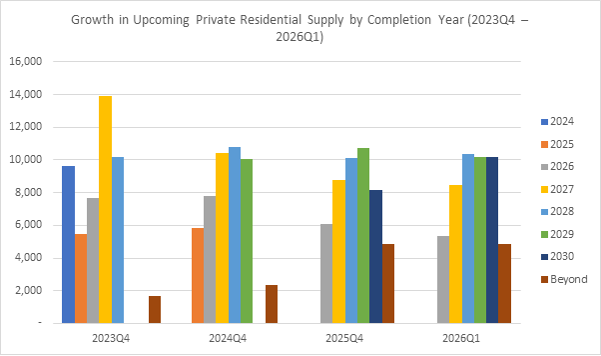
Overall, the supply picture has been disciplined: as of Q1 2026, the pipeline for 2026 stands at 5,371 units and for 2027 at 8,489 units, both lower than the same cohorts appeared two years ago (7,694 and 13,881 respectively in the Q4 2023 URA snapshot). Units planned for delivery have been completed and absorbed into the market, and the government has not replaced them at the same pace.
However, the far-horizon tail (units with no confirmed completion year) has nearly tripled from 1,694 units in Q4 2023 to 4,844 in Q1 2026. The government has also stepped up land sales considerably, with the GLS Confirmed List supply averaging roughly 10,000 units per year from 2024 to 2026 (annualising 1H 2026), versus about 6,300 per year from 2021 to 2023. Minister Chee Hong Tat committed to generating land supply for more than 25,000 new private homes via GLS from 2025 to 2027.
Developer behaviour is also signalling selectivity, with the Holland Plain tender in May 2026 drawing a sole bid from Sim Lian at $1,491 psf ppr, well below expectations. For the near-term buyer, supply conditions remain supportive, but for the longer-term investor, sustained government supply commitments and cautious developer sentiment suggest more moderate forward returns than the post-2020 period.
In the public housing segment, the HDB Resale Price Index fell 0.1% in Q1 2026, its first decline since 2019. The HDB supply-side dynamic reinforces this picture, with the number of BTO flats reaching their five-year Minimum Occupation Period set to rise from 13,500 in 2026 to 15,000 in 2027 and 19,500 in 2028, as pandemic-era completions work through the pipeline.
The Diversified Portfolio Alternative
The preceding sections examined property returns, costs, and forward-looking conditions in some detail, which begs the question: could the capital deployed in additional property generate better risk-adjusted returns, with lower effort elsewhere?
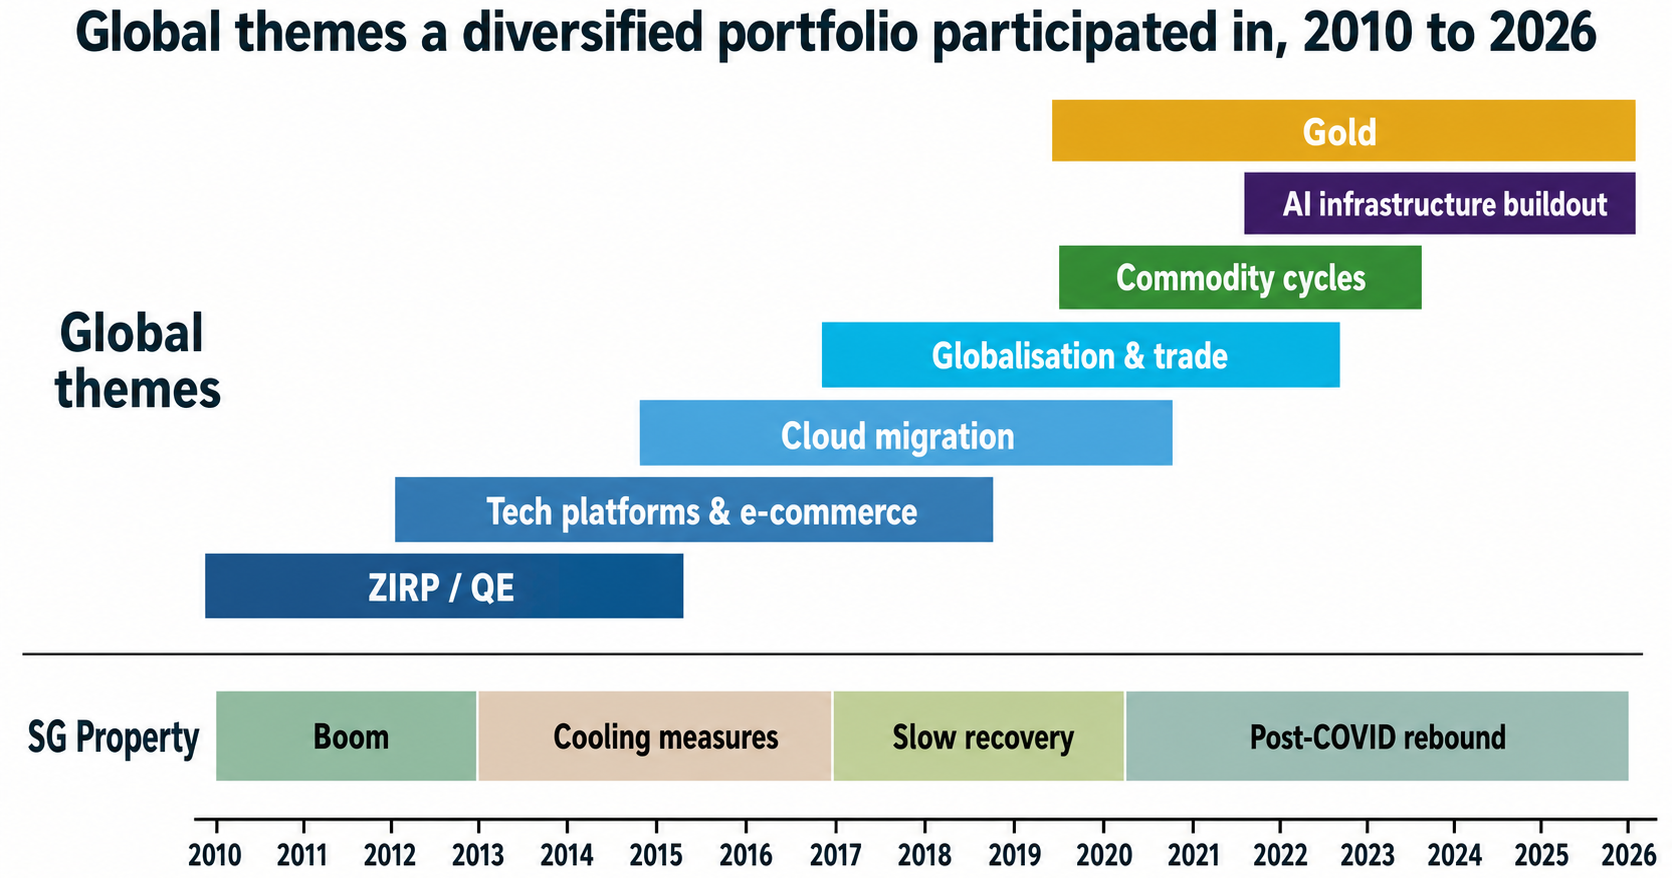
Global equities have been one of the most consistent generators of long-term wealth across asset classes. The MSCI All Country World Index returned approximately 9.4% annualised in USD terms over the past 15 years, compounding a dollar invested in 2011 into roughly four dollars today. These returns were driven by a succession of distinct themes, including the zero-interest-rate environment of the early 2010s, the rise of technology platforms and e-commerce, cloud migration across enterprise software, commodity cycles, gold, and most recently, the AI infrastructure buildout. A globally diversified equity portfolio, by construction, participated in most of them. Technology and cloud drove returns in the US. Commodities lifted parts of Australia, Canada, and emerging markets at different points. The AI capex cycle has benefited semiconductor and infrastructure companies across the US, Taiwan, Korea, and parts of Europe. Gold has delivered positive returns across multiple market environments.
Singapore property, by contrast, is exposed to a narrower set of domestic return drivers, namely GDP growth, government policy, demographics, global financial flows, and the bank-driven credit cycle. During the 2010s, while global technology earnings were growing at double-digit rates, Singapore property had to work through the effects of cooling measures and delivered minimal capital appreciation.
Exhibit 18: Global themes a diversified portfolio participated in (2010 to 2026)
 Additionally, bonds in a diversified portfolio provide a liquidity buffer that can be drawn upon without selling equities at depressed prices. For clients in or approaching retirement, funding living expenses from bond income and maturities while equities recover from drawdowns is a practical capability that an illiquid property position does not offer.
Beyond this, a single global equity fund holds thousands of companies across sectors and geographies, so the failure of one company or the weakness of one market has a limited effect on the overall portfolio, reducing idiosyncratic risk for investors whose wealth would otherwise sit in a single asset. Unlike property, you don’t have to put all your eggs in one basket or pick the right stock.
Positions can be increased or reduced in any amount, at any time, at transparent market prices. There is no three-to-six-month sale process, no agent commission, and no BSD on rebalancing. Accordingly, when circumstances change through retirement or an unexpected need for capital, the portfolio can be adjusted almost immediately.
Ongoing costs are also lower, with no equivalent of BSD, agent commissions, renovation costs, or property tax. Over a 15-year holding period, the cumulative cost difference relative to property ownership amounts to hundreds of thousands of dollars.
For most Singaporean households, employment income, residential property, and retirement savings are already tied to the domestic economy. As we explored in a previous article on concentration risk and global diversification, this creates a substantial implicit home bias before portfolio decisions are even considered. Further concentrating into Singapore property would mean doubling down on that exposure.
Conclusion
Singapore property has delivered competitive returns for leveraged owners, particularly over recent periods, and continues to serve important functions: shelter, forced savings through mortgage repayment, and a foundation for household wealth.
Yet property returns are path-dependent, driven by a narrow set of Singapore-specific factors, and subject to drawdowns that have lasted for over a decade. The demographic tailwinds that powered demand over the past three decades are slowing, and the current market, with rising vacancy and a larger incoming supply pipeline, points towards more moderate returns ahead.
Consequently, property can remain a valid part of household wealth, but incremental exposure should clear a higher hurdle. The investor gives up liquidity, diversification, flexibility, and operational simplicity. Accordingly, the expected return on the next dollar of capital should be sufficient to justify that trade-off.
The writer of this market review, Glenn Tan, is Senior Portfolio Manager at Providend Ltd, Southeast Asia’s first fee-only comprehensive wealth advisory firm. He is also a CFA Charterholder and a Certified Financial Risk Manager (FRM).
For more related resources, check out:
1. S2E37: Does Property Fit into Your Overall Investment Portfolio?
2. Investing in Property or Equity? Top Tips Here!
3. Should Gen Z Rent or Buy Their First Home in Singapore?
Download our Investment eBook titled “A More Reliable Way to Get Enough Investment Returns: Even During Times of Market Uncertainty” here.
With a minefield of financial misinformation out there, we promise to be a safe pair of hands and a second pair of eyes to help you avoid costly financial mistakes. Learn more about our investment philosophy here.
We do not charge a fee at the first consultation meeting. If you would like an honest second opinion on your current estate plan, investment portfolio, financial and/or retirement plan, make an appointment with us today.