Executive Summary
- Recent strength in the Singapore equity market has understandably prompted investors to question whether globally diversified portfolios remain necessary, particularly after two years of strong local returns and a firm Singapore Dollar. This paper examines that question through a structured, evidence-based lens. Using Singapore as a case study, we analyse the underlying composition of the market, decompose recent returns using the Ibbotson–Chen framework, and evaluate whether the drivers that powered the recent rally are likely to persist. The goal is not to dispute the quality of Singapore’s market, but to assess whether recent performance alone justifies a structural increase in portfolio weight.
- Our analysis shows that a significant portion of recent gains has been driven by cyclical forces, most notably via bank net interest margin expansion, post-pandemic recovery effects, and valuation multiple expansion. At the same time, the investable Singapore market remains highly concentrated by both sector and earnings drivers, with financials and property-related segments dominating index composition. This structure has historically produced periods of solid income and episodic outperformance but also extended phases of muted earnings growth when key macro tailwinds fade. Similar patterns can be observed in other concentrated Asian markets. When investors increase exposure following strong performance, they are often taking on a narrower set of sector and factor risks than intended, while potentially reducing participation in broader global growth engines.
- In an uncertain forward environment, portfolio resilience depends less on identifying the next winning market and more on maintaining exposure to a wide and durable set of earnings drivers. A globally diversified portfolio, weighted broadly in proportion to the global opportunity set, remains the most reliable framework for achieving this objective. Tactical tilts and measured home bias can be appropriate at the margin for specific investor circumstances, but these decisions should be grounded in structural considerations rather than recent market strength. For most Singapore-based investors, whose economic exposure is already heavily tied to the domestic cycle, global diversification continues to play a central role in balancing long-term portfolio risk and return.
Introduction
In recent client conversations, the subject of the recent performance of local stock markets has been a recurring theme. With the Straits Times Index (STI) having returned 8% year to date, after having delivered equally stellar performances of 28% and 23% in calendar years 2025 and 2024 respectively, several investors have begun to ponder the question: Why do I need to invest in globally diversified portfolios if local financial markets are capable of delivering such returns? After all, we would be investing in companies which are closely familiar to us as Singaporean residents, at least far more so than a little-known company in a far-flung corner of the world.
Adding to the weight of such considerations is the recent performance of the Singapore Dollar, which appreciated by 6.16% versus the US dollar in 2025, and has appreciated by another 1.69% this year at the time of writing. Close to home, other Asian equity markets such as Japan, Korea and Taiwan have also performed exceedingly well over the past year.
Alongside these currency movements, concerns about de-dollarisation and the concentration of US technology giants and AI-related companies in global equity indices lend further weight to the argument for overweighting one’s home market or even region.
Given the above, it is indeed reasonable for investors to think along these lines. Broadly speaking, investors are looking for their investment portfolios to tilt towards markets which are performing well, rather than abandoning diversification as an investment principle altogether.
In this article, we feature the Singapore equity market as a case study to understand the drivers of stock market returns over the past few years and discuss the possible outlook for the market using the same framework. Further, we extend the discussion to global markets and answer the question of whether it is a good idea to increase the weight of Singapore stocks in an investor’s strategic asset allocation. We also discuss the behavioural finance underpinnings behind such motivations and the associated costs and benefits to long-term returns.
Composition of the Singapore Equity Market
When considering an incremental investment in Singapore equities, the first point of consideration is to understand the composition of the market itself. The benchmark STI index is most often used as a representation of local equity markets in general. It has 30 components, with the following being the top 10 holdings as of December 2025:
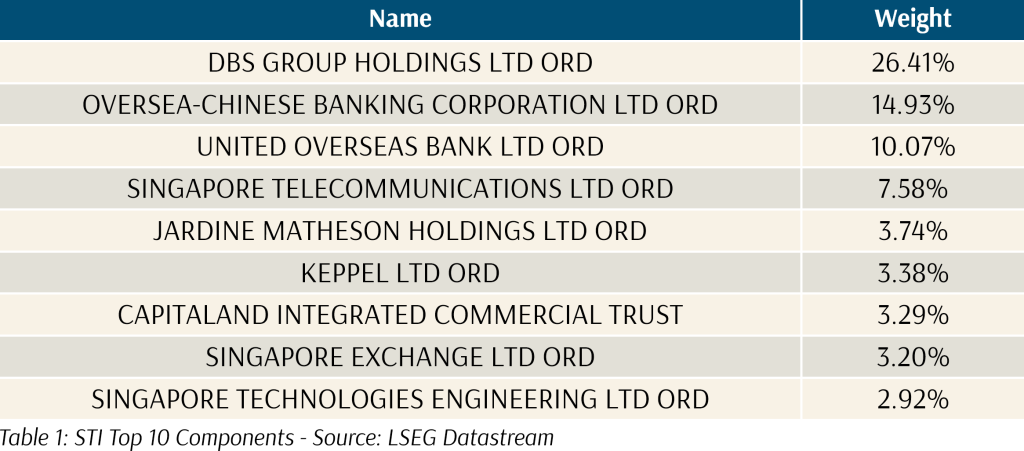
Industry and single-name concentration is exceedingly high in the Singapore market, with the top three banks accounting for 40% of index weight, and DBS alone accounting for 25% of the index. These top ten components account for a total of 75% of the index.
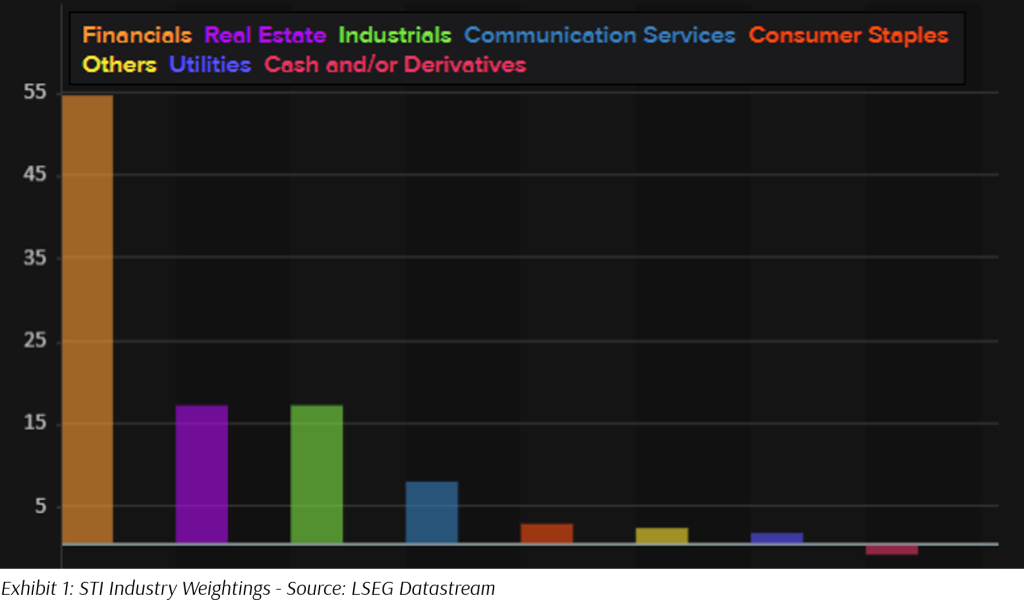
Examining Exhibit 1 below, it is clear that the STI Index is overwhelmingly allocated to financial and real estate sectors, with those two accounting for more than 70% of the index.
Another often-used benchmark is the MSCI Singapore Index. The top 10 components are shown in Table 2 below:
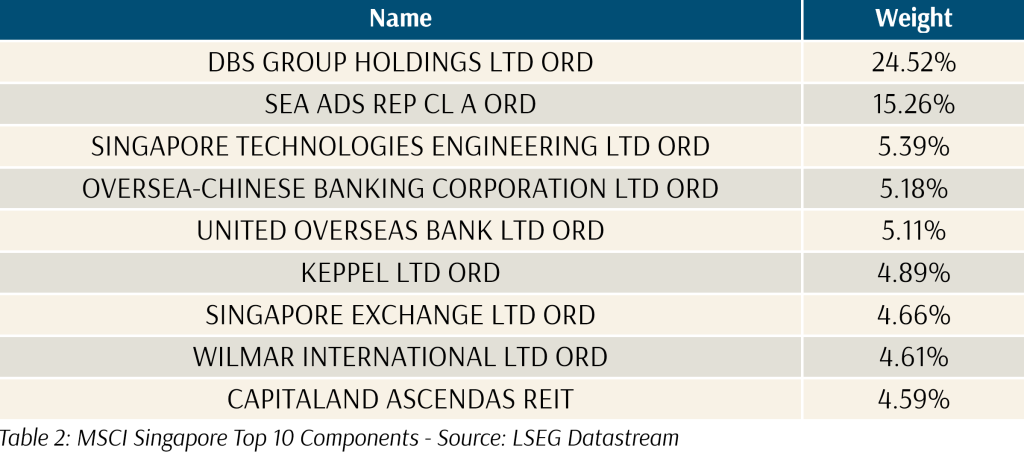
The holdings in this benchmark differ from those of the STI, with the inclusion of US-listed SEA Limited and Grab Holdings being the key differentiators. However, the same trends dominate, with DBS still at a 24.5% allocation and SEA Limited holding a 15.26% allocation. Banks now account for a 34% allocation. With the entire benchmark now holding only 20 stocks, as opposed to 30 stocks for the STI index, the top ten concentration is even higher at 78%.
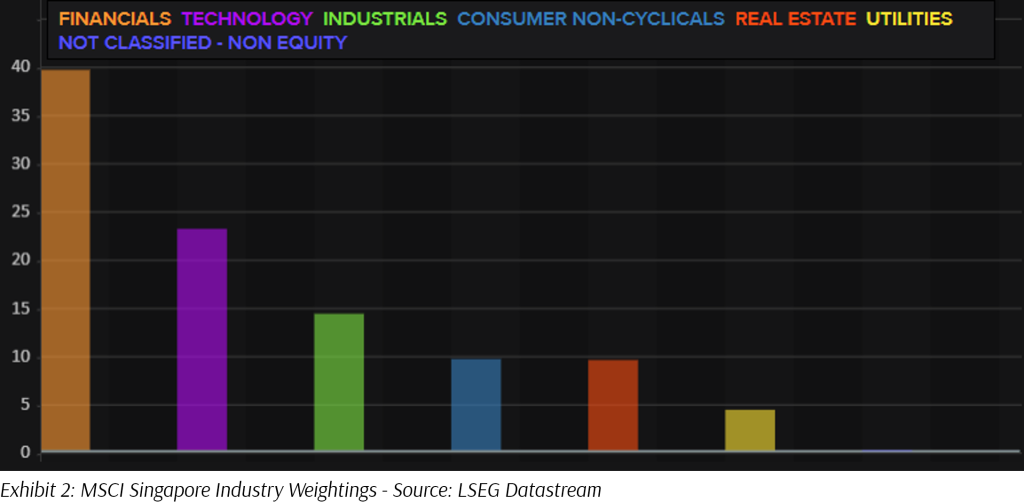
In the case of MSCI Singapore, we do obtain a sizeable allocation to Technology through SEA Limited and Grab Holdings. There is a distinct lack of real estate exposure compared with the STI index. We should note that this technology exposure is also of a somewhat limited nature, due to the specific technology sub-industries and geographies in which SEA and Grab operate, namely e-commerce, online gaming, ride-share platforms and financial services.
Investors may rightly ask why these indices are constructed in this manner, and why portfolios must follow these benchmark indices. Due to liquidity and size structures in the Singapore market, index providers have little choice but to do so. Indices are designed to be easily translated and replicated into tradable instruments such as exchange-traded funds and other pooled vehicles. Stocks with low liquidity and that cannot easily be traded do not lend themselves well to such products.
The next question would naturally be why stocks with sufficient liquidity and size are limited to this relatively small group of banks, REITs and technology platforms. The explanation lies in economic fundamentals. In the universe of investable companies listed on the Singapore market, this small group of companies accounts for an overwhelming majority of revenues, profits and cash flows. Thus, they command the market capitalisation necessary to be viable investable candidates, and correspondingly the liquidity and trading activity required to be included in an investment portfolio.
Therefore, investors looking for passive incremental participation in the Singapore equity market will most likely use a vehicle benchmarked to either of these indices. Others who prefer to use active funds, or adopt a do-it-yourself approach, will have to contend with manager risk and strategy risk, as well as higher management fees. Investors who move significantly away from benchmark heavyweights into smaller capitalisation stocks may face lower liquidity, weaker analyst coverage, and poorer corporate transparency and disclosure.
Drivers of Returns in the Singapore Equity Market
At Providend, in our estimation of long-term returns in capital markets, we utilise the Ibbotson-Chen supply-side model. In their Financial Analysts Journal paper, Ibbotson and Chen estimate the forward-looking long-term equity risk premium by decomposing historical equity returns into supply factors such as inflation, earnings, dividends, and P/E changes, among other factors.
In this instance, we will focus on the supply factors of earnings growth, dividends, and P/E changes. In Exhibit 3 below, the yellow area depicts 12M forward earnings for the MSCI Singapore Index, while the light blue line depicts the Price-to-Earnings ratio calculated on these 12M forward earnings. The green line depicts the price of the MSCI Singapore Total Return Index itself, and finally, the maroon line depicts the 12M forward dividend yield of the index.
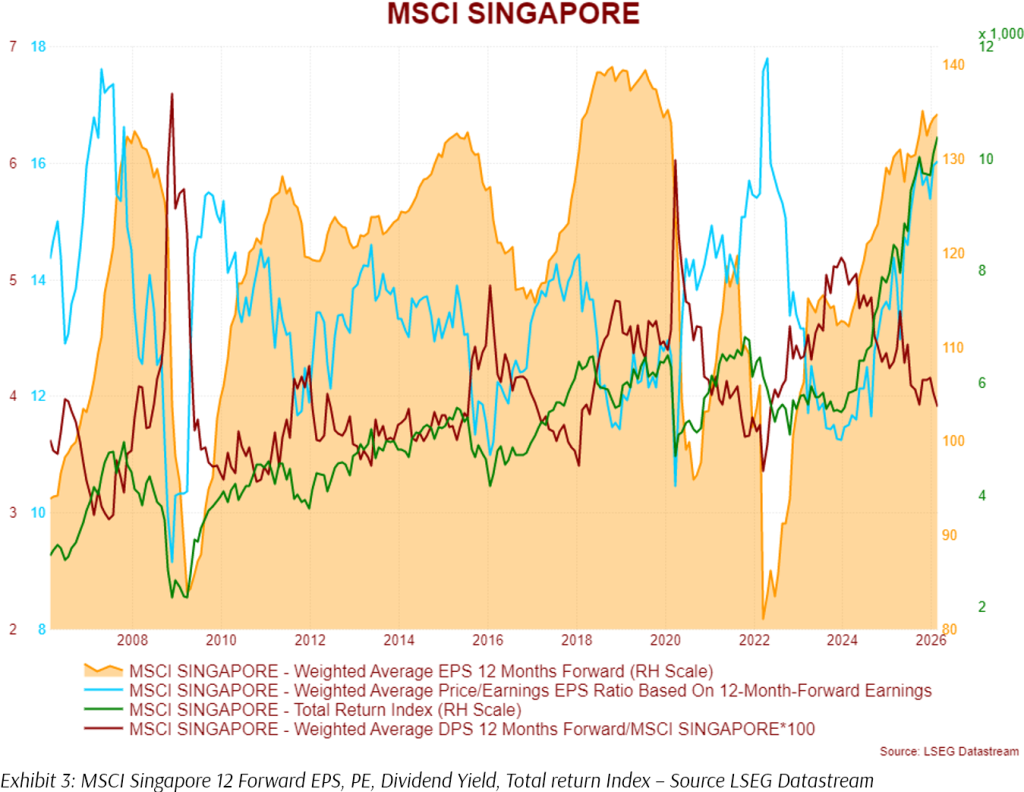
If we focus on the period over the past 3 years from February, we can observe that the strong returns observed for the Singapore market were driven by both earnings growth and a significant expansion in the P/E ratio. From February 2023 to February 2026, earnings grew from 107 to 135.6, a 3-year CAGR of 8.16% per annum, or a total gain of 26.7%. Over the same period, the P/E ratio expanded from 13 times to current levels of 16 times. Along with an estimated average dividend return of 5% p.a. over the 3-year period, this fully decomposes the 80% total return in the MSCI Singapore Index over the past 3 years.
Looking forward, we discuss each of these return drivers to determine if the investment case for Singapore truly warrants an outsized allocation within a diversified portfolio. The current forward dividend yield of the market now stands at 3.91%, which is slightly lower than the long-term average of 4.01%. The P/E ratio of 16.03 stands at the 95th percentile over the trading range of the past 20 years. Finally, based on current earnings estimates, earnings growth is expected to slow down from a CAGR of 8.16% over the past 3 years to 6.76% p.a. over the next 3 years. This growth is front-loaded, and is expected to slow down to 4% in the third forward year, which is just a touch above the historical 10-year CAGR of 3.45% p.a.
What Return Should We Be Expecting From the Singapore Market Over the Next 3 Years?
On the dividend return front, it is reasonable to assume slight growth in dividends and put in place a value of 4% per year for the next 3 years. On the earnings front, we may assume that analysts will be right and we achieve 6.76% CAGR over the next 3 years. That leaves us with the P/E ratio, which is a complicated affair to model, involving both structural and cyclical drivers that are somewhat beyond the scope of this discussion. Amongst these drivers, the risk-free rate, long-term earnings growth, and profitability are the most important ones. As we discussed in the earlier section, a market heavy with banks, financials, and REITs such as Singapore typically attracts a lower long-term valuation, which is simply a reflection of underlying fundamentals. External factors like the MAS’s broader S$5 billion programme aimed at revitalising the local equities market do provide support for valuations, but such boosts are mostly one-off and temporary in nature, and are unsustainable if the underlying structural drivers do not change.
Hence, given that the underlying structural factors are unchanged, and with earnings growth slowing to trend levels, it’s possible to see valuation multiples revert to a 20-year average level of 13.5. If earnings tend towards historical realisations instead of analyst expectations, a reversion in valuations and a consequent valuation drag on returns is more likely. On the other hand, should earnings eventually come in better than expectations, valuation levels are more likely to hold. Bearing this in mind, we lay out a series of estimates for various growth and valuation scenarios over the next 3 years.
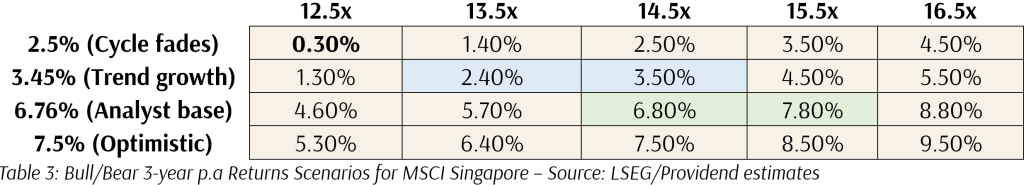
Based on the scenarios above, the higher-probability outcomes are highlighted, with the lower end coming in at 2.4% versus the higher end at 7.8%, with the midpoint at 5.1%.
While 5.1% is a respectable return, it is below the 20-year CAGR of 6.45% for the MSCI Singapore Index and well below the long-term expected return of 8.45% for a globally diversified equity portfolio.
As with all estimates, outputs are subject to variance and uncertainty. For example, realised earnings growth may be higher or lower than current expectations. Valuation multiples may persist, in which case realised returns are likely to be higher without the compression drag. The point of this exercise is not to produce deterministic answers, downplay the performance of the Singapore market, or make a contrarian call that the Singapore market has topped out, but to illustrate a clear process grounded in economic fundamentals that investors can undertake when considering the prospects of a specific market.
A reasonable sequitur to the analysis above may be: Why should Singapore stocks be limited to these scenarios – what if we’re entering a “new dawn” for the stock market and perhaps Asian markets in general? While structural changes in the future may indeed bring about such an outcome, for the time being, we examine the key earnings drivers in the market to assess the likelihood of such a scenario in the next section.
A Closer Examination of Recent Earnings Drivers in Singapore
Beyond considering returns from a top-down earnings- and multiples-driven approach, it is also instructive for investors to take a closer look at the earnings drivers behind the impressive rise in MSCI Singapore earnings from 2022 to 2025. Beneath the hood, we found the following factors to be the largest components of the increase in earnings:
-
Banking sector NIM expansion
-
Interest income tailwinds across financials
-
Air travel and related industries recovery
-
Property optimism/REIT stabilisation
-
Capital management
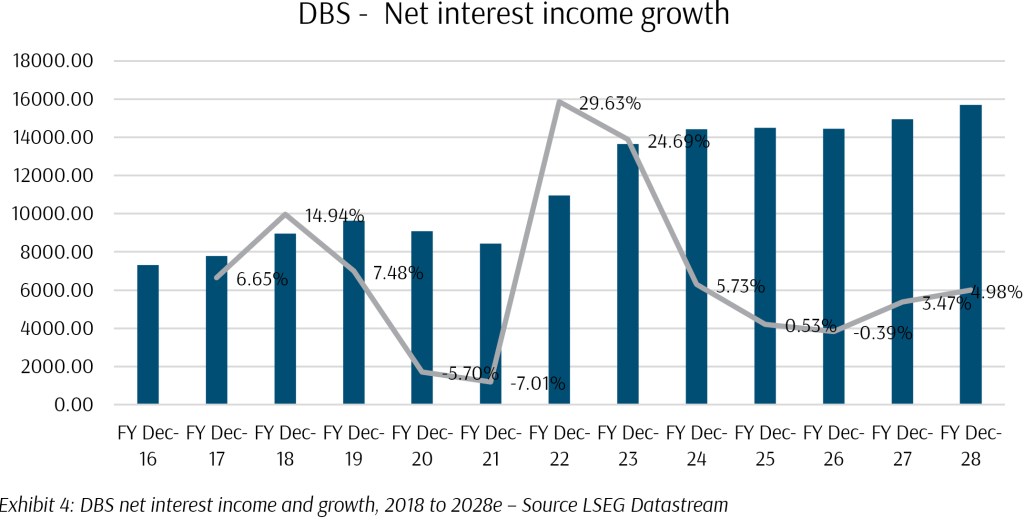
Clearly, bank earnings played an outsized role in delivering earnings, given their weight in the index. From 2022 onward, SORA/SIBOR surged, and MAS tightened policy via a steeper NEER slope. Deposit rates lagged initially, while loan yields repriced quickly, leading to net interest margins widening sharply, significantly boosting earnings at an index level. These earnings boosts also significantly improved the capital position of banks, allowing for capital returns and special dividends. We can observe this in Exhibit 4 below, which shows net interest income rising by nearly 30% and 25% in FY22 and FY23.
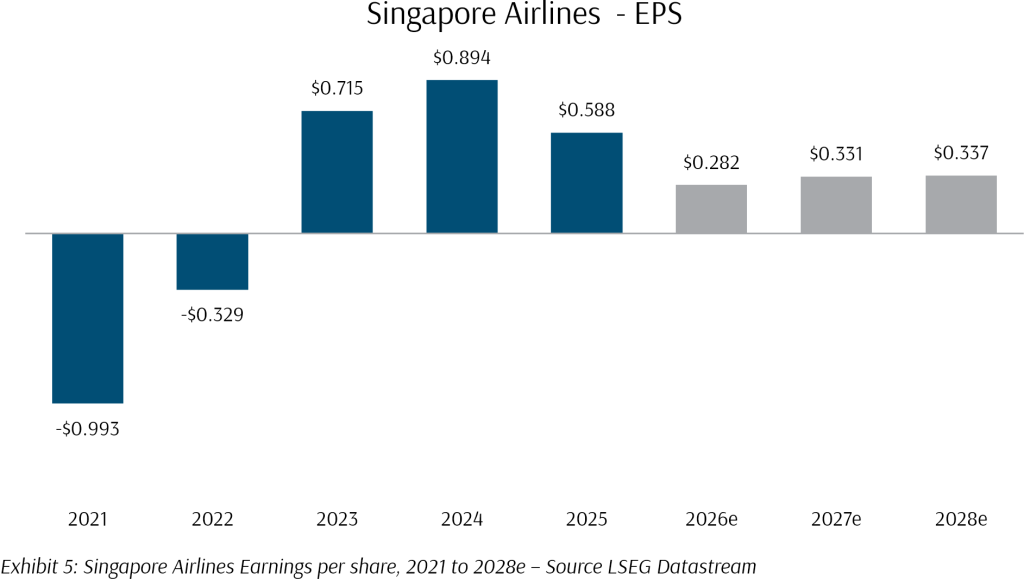
Following the above, the post-COVID recovery in air travel and related sectors also played a strong role in earnings acceleration. Singapore Airlines earnings swung from an extreme loss to a record high by the end of 2025, while the boost provided to ST Engineering’s aircraft MRO division earnings reached new highs.
In contrast, REITs faced a more difficult environment during the same period of aggressive rate rises. However, rental reversions held up better than feared, while balance sheets generally remained intact and investment grade. Falling interest rates in 2025 have also contributed to a rebound in sentiment in the property sector, driving property companies’ share prices from decade lows to decade highs in a matter of months.
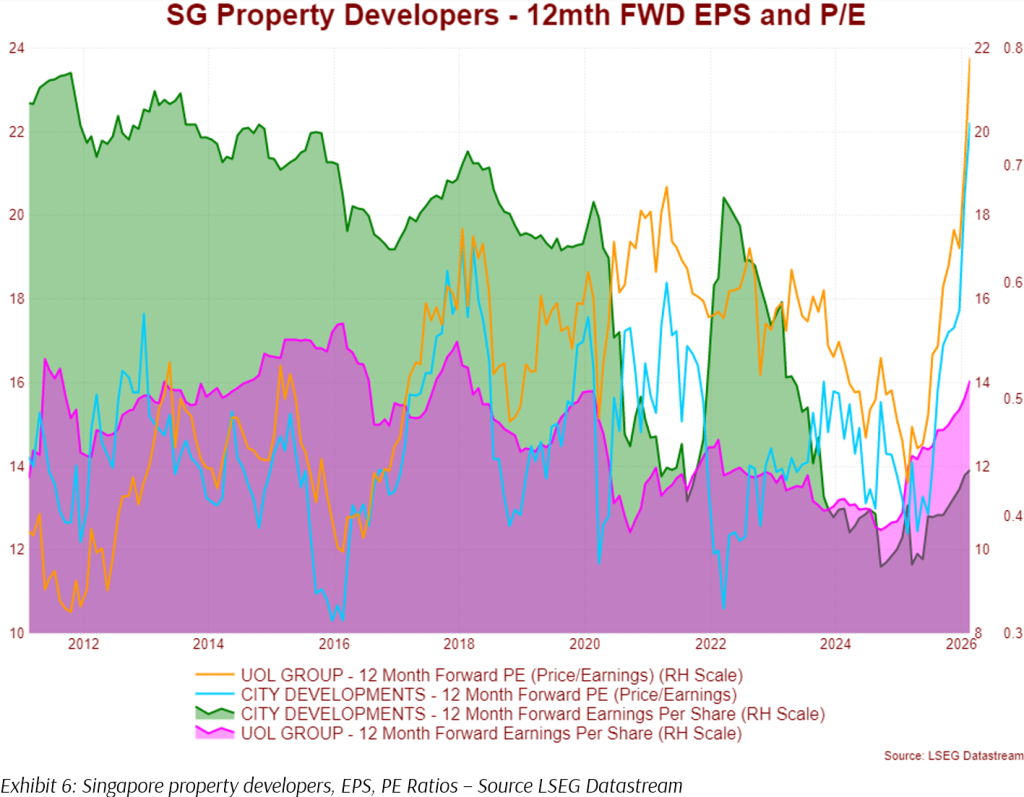
Looking Forward: Are the Same Earnings Drivers Sustainable?
Within the same exhibits, we can observe that these key drivers of earnings growth over the past 3 years have somewhat diminished. For DBS, net interest income growth is expected to average in the low single digits over the next 3 years. Short-term interest rates are approaching 1% again. For SIA, EPS is expected to decline significantly from the peak in 2024. For property developers, we can see that while earnings have finally risen above decade lows, valuations have already priced in more than 20% EPS CAGR per annum through the next 3 years. In other words, many drivers of EPS growth are no longer in place, or have already been priced into the market.
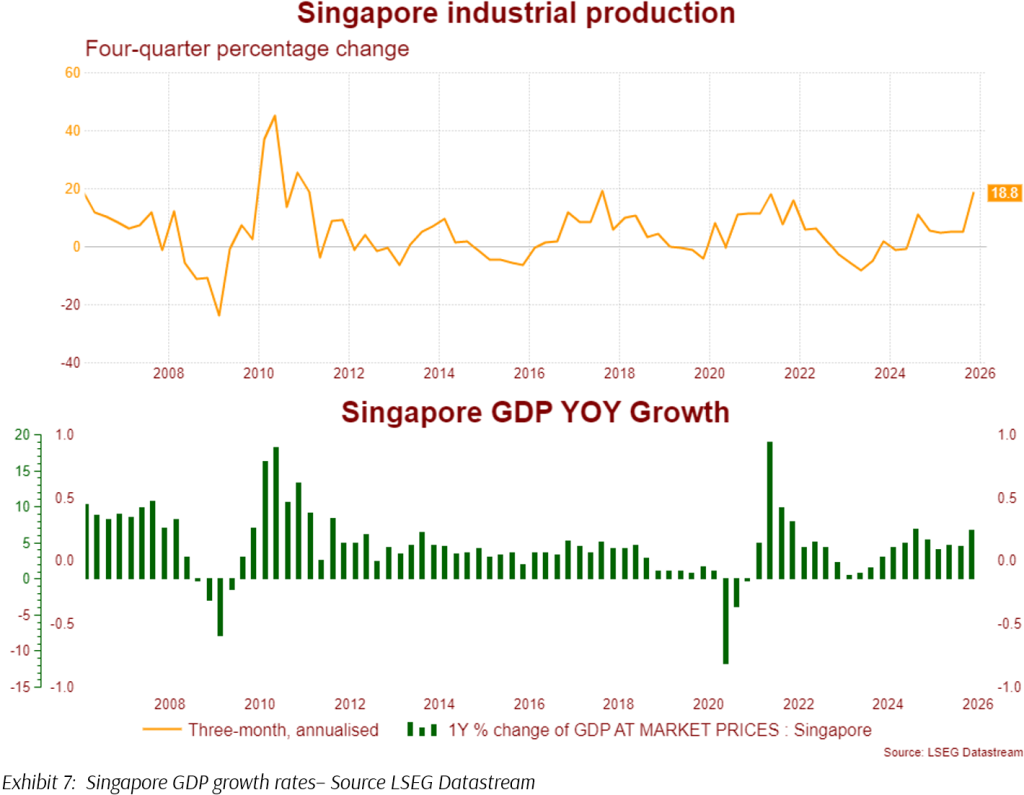
From a broader economic perspective, Singapore has just experienced two years of back-to-back 5% GDP growth, driven by a perfect storm of capital flows, global tariffs, and the AI capex gold rush, which spilled beyond semiconductors and tech exports into wholesale trade, logistics, and finance. Singapore received a lower tariff rate than many regional peers and key pharma and semiconductor exports also escaped tariffs, while pull-forward demand ahead of tariffs boosted exports. Capital flows over the same time boosted profits for financial services.
While these economic drivers may remain positive for some time, growth is expected to slow down in 2026. Historical evidence has shown that many aspects of Singapore’s economy, particularly in exports, have always been cyclical. Hence, while Singapore will always remain a high-quality destination for investment, it is likely that the economy is at or even past a cyclical peak.
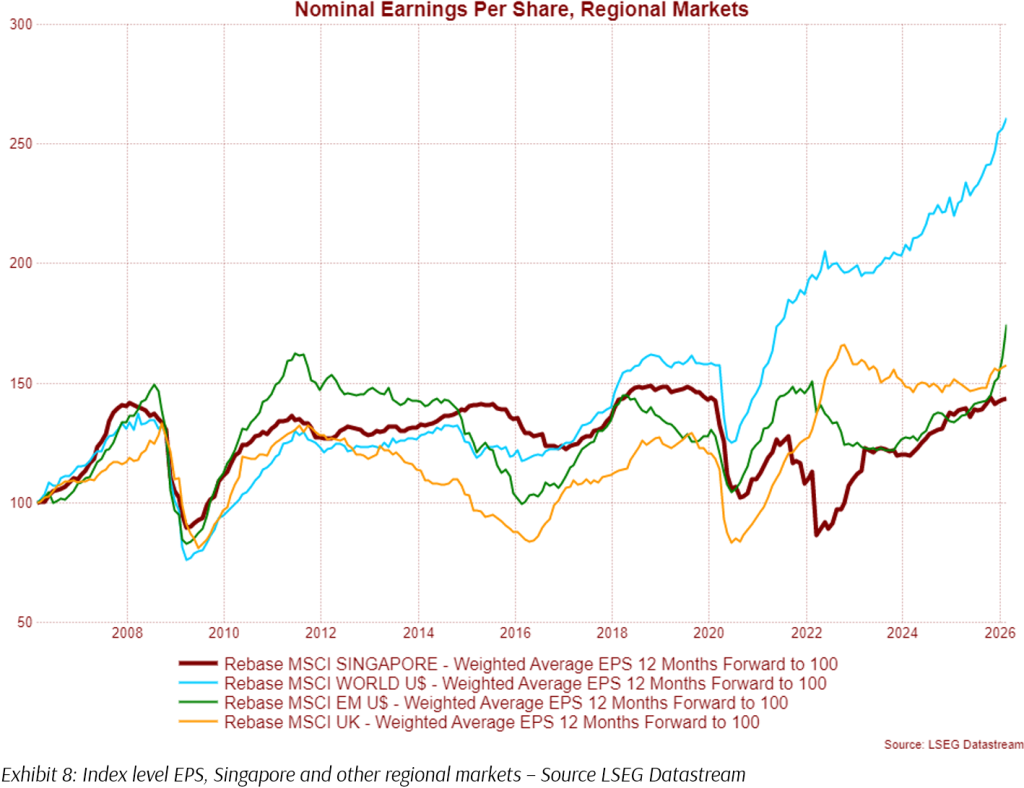
The inherent cyclicality of the economy in Singapore can also be observed in the earnings of the Singapore stock market. In Exhibit 8, we see that compared to earnings of the MSCI World Index, being the blue line in the chart, EPS growth in MSCI Singapore has been markedly lower over the past 20 years. Nominal earnings in MSCI Singapore have not/barely surpassed prior cyclical peaks in 2008, 2016, and 2019.
In contrast, earnings for the MSCI World Index have grown more than two-fold over the past 20 years. This may be confusing for some investors, given the continued and relentless growth of the economy and household wealth of Singapore over the same time period. The answer lies in the facts discussed in the first section of this article: The composition of the investible Singapore market is dominated by cyclical companies like banks, REITs, financials, property developers, and other industrials. These companies are heavily exposed to macroeconomic factors that fall outside the control of management, regardless of quality. They also predominantly operate in smaller Singaporean or regional geographical locales, lacking the size and wealth that markets in, for example, the United States or China enjoy. This cyclical characteristic is not unique to Singapore – the MSCI UK Index, a developed economy, depicted by Exhibit 8 with the orange line, is also dominated by a mix of cyclical financial and energy companies, and shows a much slower pace of net EPS growth over time.
A Risk Factor Framework to Support Globally Diversified Portfolios
Following the discussion above, it might appear that we are suggesting that investors should not invest in cyclical markets at all, given the limitations that they face in accruing higher earnings growth over time. That is not the case. Cyclical markets play an important role in a diversified portfolio. On top of delivering a more sizeable and consistent dividend yield return, cyclical stocks may be sensitive to macro-risk factors in a fashion that complements a portfolio more heavily weighted towards growth stocks. For example, from 2022 to 2024, we saw rapid increases in global benchmark rates which severely impacted growth stocks across the board. While damaging to some stocks, the interest rate macro factor was resoundingly positive for some segments, with our Singapore banks being the key beneficiaries. To the extent that these higher interest rates didn’t result in higher default rates, higher rates contributed greatly to the rising net interest margins which powered Singapore markets to two years of solid gains.
Yet, through much of the 2010s, the Singapore market could not match the performance of overseas growth markets, represented by the MSCI World Index. Through the decade, investors endured very sub-par returns, which would have fallen well short of most financial planning expectations. Obviously, investors who were able to persist into the 2020s eventually experienced the recent resurgence. Nonetheless, the “lost decade” of the 2010s would have been very damaging to investors who didn’t quite have the time horizon to wait out this underperformance.
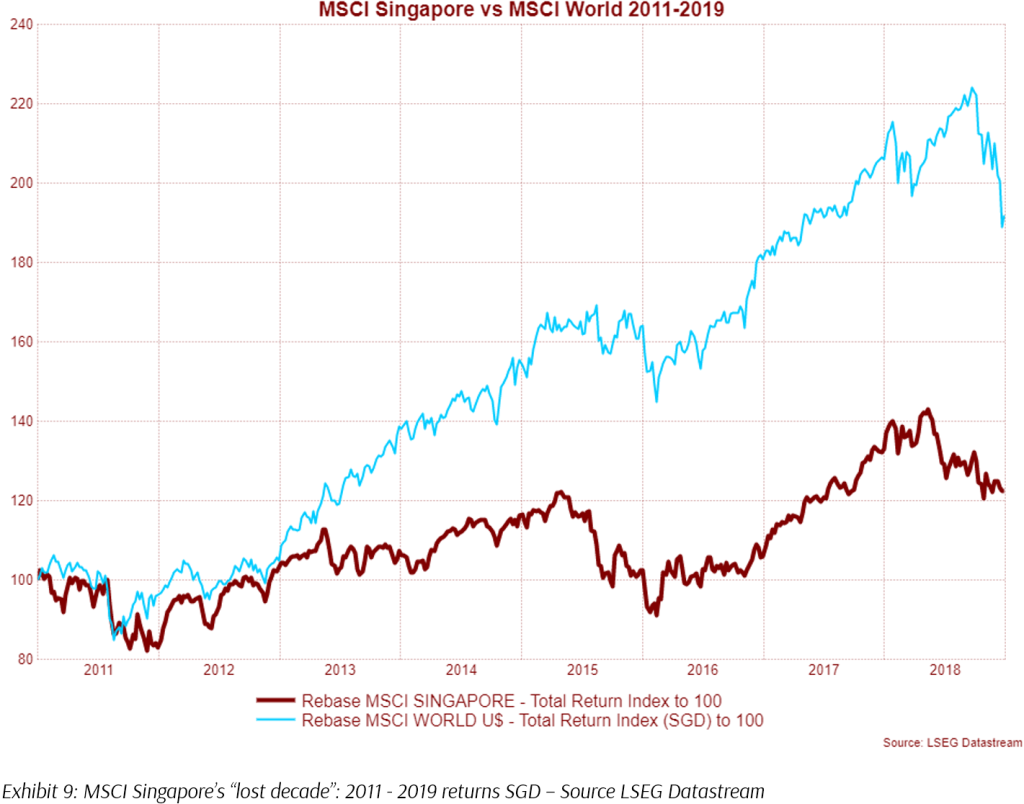
Why did the “lost decade” happen in Singapore stocks? There are a myriad of reasons why, but from a macro, top-down level, and in line with our discussions earlier, the Singapore market simply did not have the mix of risk and return factors necessary to drive earnings and dividend growth, as well as expand valuation multiples over the period. The growth of technology and internet earnings largely passed the market by, given the lack of companies in that space, while property companies suffered through various cooling measures and had to slowly work off the leverage accumulated over the past decade. The same period was one of comparatively weaker GDP growth for Singapore. Accordingly, economically sensitive consumer discretionary sectors experienced little to no earnings growth, while banks were least able to eke out some earnings and dividend growth through the difficult period.
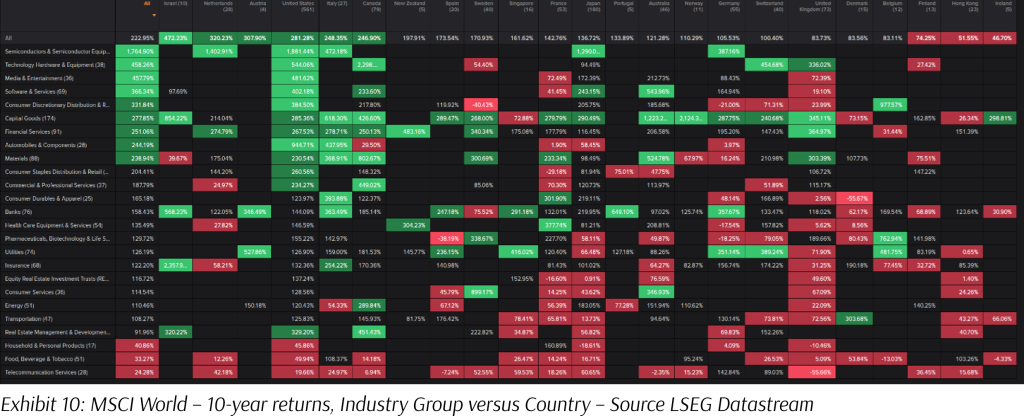
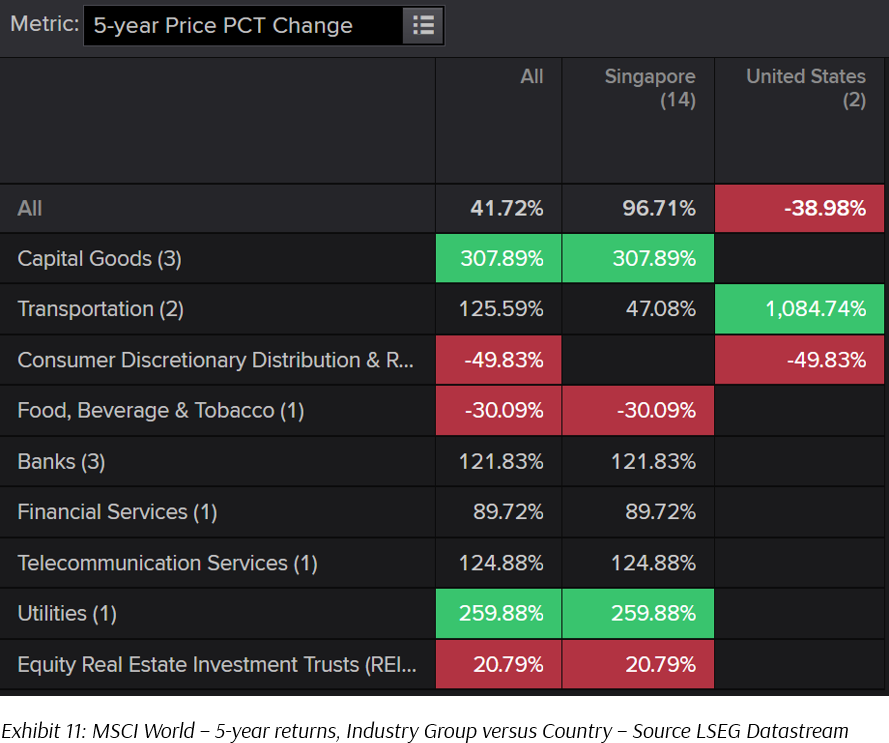
To further illustrate our point, Exhibits 10 and 11 show the spread of risk factors, as approximated by countries and industry groups, of the MSCI World Index, followed by the MSCI Singapore Index. Each row represents a separate industry group, while each column represents a different country. We can see the spread of risk factors offered by the MSCI World Index far exceeds that of the Singapore market.
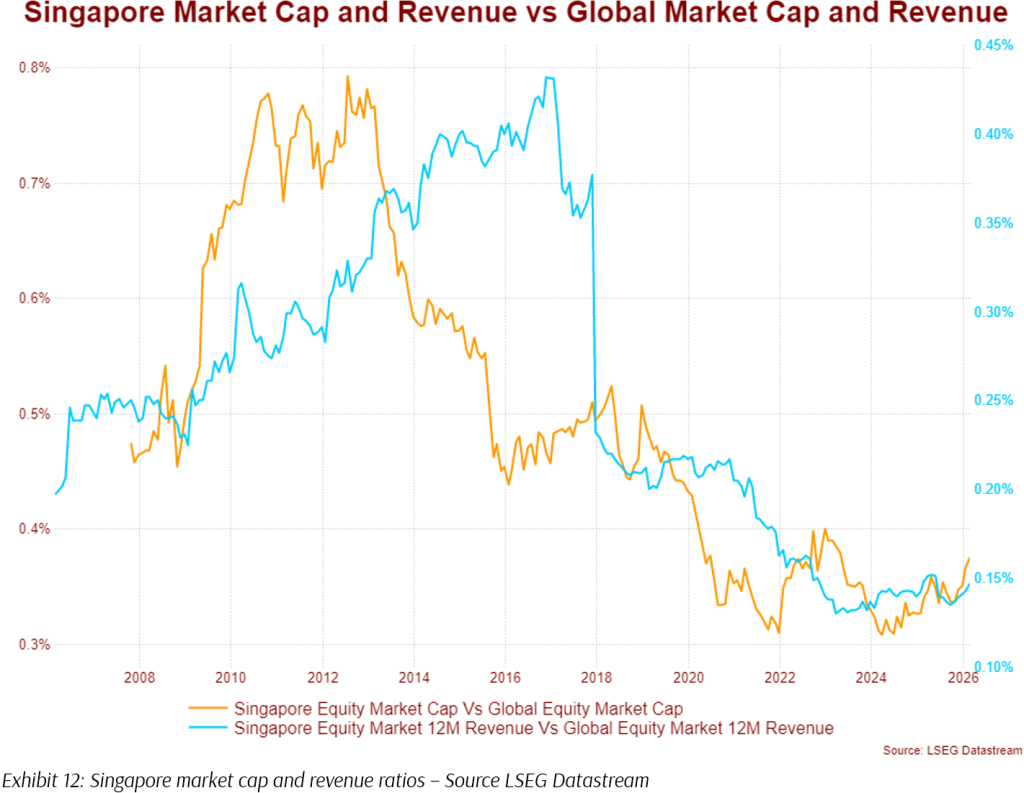
Next, we examine the market capitalisation of, and revenue generated by, the Singapore equity market versus the global equity market. The Singapore market commands only a minute share of global capitalisation and revenues.
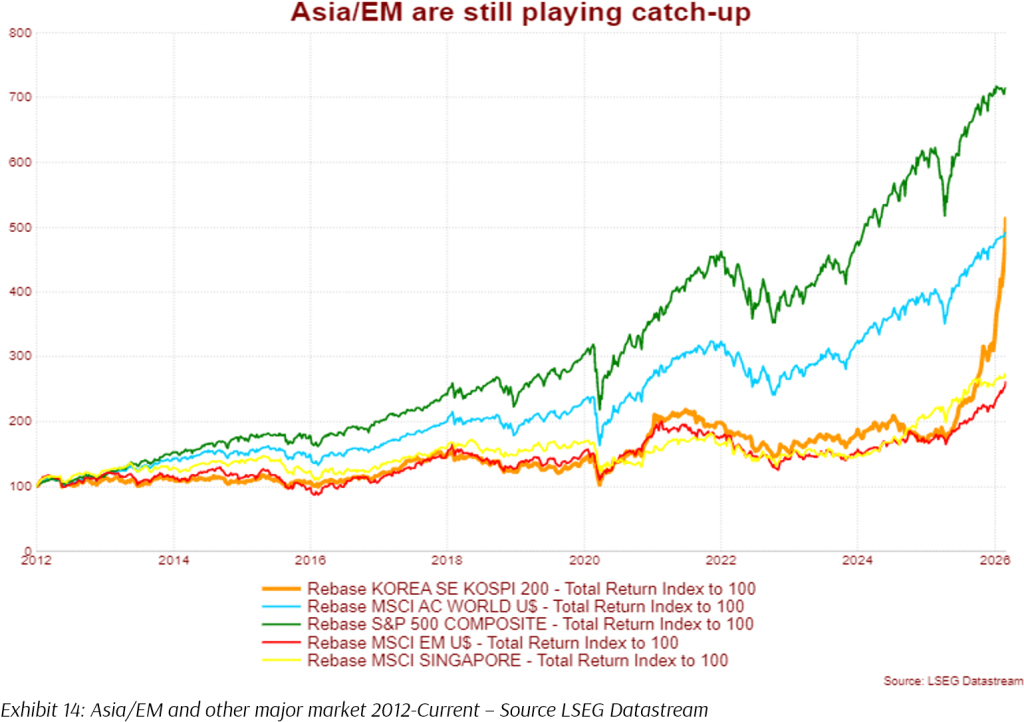
Korea: Recent Outperformance Hides Another Lost Decade
We round up the discussion with a look at another market which has shown extraordinary performances in 2025 and this year – the Korean equity market, which is up an astonishing 52% through the first 2 months in 2026, after a 90% return last year, driven by the massive AI capex boom that has seen memory and semiconductor chip pricing explode.
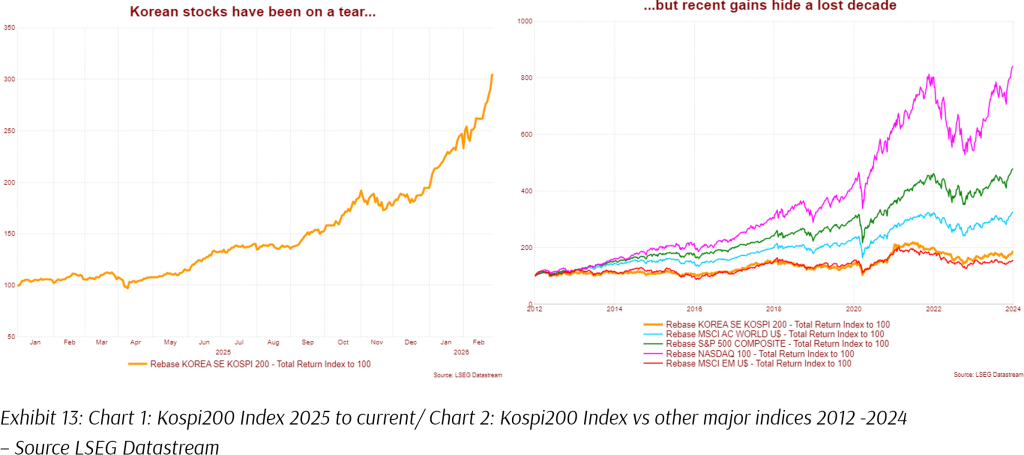
However, for the entire 2010s and early 2020s, the Korean market, and indeed the MSCI EM Index along with it, languished as perennial underperformers, turning in year after year of insipid performances while extinguishing the financial goals of investors who were all-in on these markets. While this may matter less for investors who were able to sit through the decade-long consolidation, many investors undoubtedly suffered life-changing consequences.
Why did this lost decade occur? The reasons are now already familiar to us: narrow earnings and macro risk factor drivers in an overly concentrated market where a specific technology sector made up more than 50% of the index meant that the market could not go anywhere unless those industries were growing, and these industries faced several challenges in the past decade. In recent years, fortunes have obviously turned. Even so, these markets are still playing catch-up to diversified global portfolios. Without the lottery ticket of AI capex, Korean markets would likely have remained laggards well into this decade.
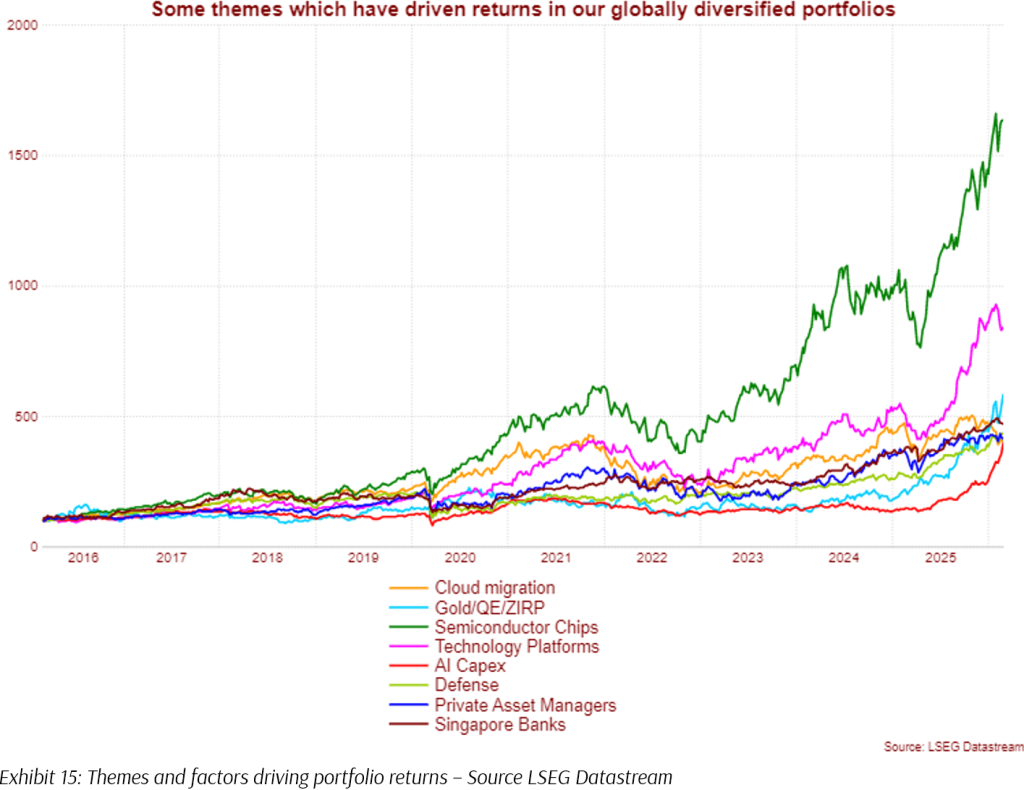
In the meantime, diversified global investors have benefited from all the following themes which have driven equity returns over the past decade: ZIRP, QE, Technology Platforms, Globalisation, Digitisation, Cloud Migration, Commodity Booms, Gold, AI, etc. The list goes on and on.
Ultimately, the returns experienced by any equity market are determined by the underlying risk factors and earnings drivers to which that market is exposed. Markets influenced by only a narrow set of factors will inevitably experience periods of prolonged underperformance when those drivers weaken or reverse, giving rise to what investors often recognise as a “lost decade.” A globally diversified portfolio seeks to broaden exposure across a wider range of industries, economies, and return drivers, reducing dependence on any single economic outcome or market cycle.
While periods of weak performance may occur in individual markets from time to time, diversification materially lowers the probability that investors experience such outcomes at the portfolio level. In an uncertain world where leadership rotates unpredictably across regions and sectors, portfolios supported by a sufficiently broad set of earnings drivers are far more likely to deliver the consistent long-term returns required to achieve financial objectives.
Currency Considerations
Recent depreciation in the US dollar has also increased investors’ concern about global investments, and increased investors’ interest in the Singapore stock market, given strong recent performance of both the market and the Singapore dollar. We do not believe that normal cyclical depreciation in foreign currencies should deter investors from investing in globally diversified portfolios.
Behavioral Finance Considerations
Empirical finance literature has long documented that capital tends to flow toward recent winners. A foundational study on mutual fund flows finds that consumer investment decisions respond strongly to prior performance information. Later work continues to show that flows tend to be “performance chasing,” and that the flow–performance relationship is often non-linear, with winners attracting disproportionate inflows. There is a tendency for investors to update beliefs by overweighting recent experience, otherwise known as “recency bias.” However, when a market or region’s good news becomes widely accepted, it is often already embedded in prices. Some evidence of this can already be observed through valuations in the Singapore market.
Recency bias and performance-chasing aren’t limited to retail investors. Market commentators and analysts are equally prone to chasing trends and proclaiming “Golden Ages” after an extended period of strong performance, in the process extrapolating cyclical peaks and troughs into perpetuity.
Ultimately, while an investor making a move to over-weight the Singapore market in their portfolios may feel like they are responsibly diversifying or even avoiding de-dollarisation, the reality may be more akin to chasing a hot market, and taking on a concentrated sector and momentum factor bet close to a cyclical peak.
Specific Consideration for Singaporean-Based Investors
Most Singapore-based investors already carry a meaningful implicit home bias, before their portfolios are even considered. For many households, employment income is tied to the domestic economy, residential property represents the single largest balance sheet exposure, and CPF savings are predominantly SGD-linked. Taken together, this creates a substantial concentration of economic risk in one small, open economy whose growth, interest rate sensitivity, and property cycle are closely intertwined.
Against this backdrop, further increasing exposure to Singapore equities compounds overall portfolio risk. The role of a liquid investment portfolio is not to mirror risks investors already bear through their careers and property holdings, but to broaden the set of earnings drivers and economic exposures supporting long-term wealth. For most Singapore residents, global equities are less about reaching abroad for incremental return and more about restoring balance to a household balance sheet that is already structurally tilted toward Singapore.
Conclusion
It is entirely understandable why the recent strength in Singapore and parts of Asia has prompted investors to revisit their strategic allocations. Strong local market returns, a resilient SGD, and renewed regional optimism naturally invite the question of whether portfolios should angle more aggressively toward what has been working. Yet investment decisions made at cyclical highs are often those most exposed to future disappointment.
While it may seem facetious for us to say that the only reliable path for long-term investors is through a globally diversified portfolio, particularly when the past three good years have no doubt helped some investors achieve their goals, we must remain grounded in a simple reality: we are dealing with uncertain future outcomes for which there is no certainty that the single path of the past will be replicated. Singapore remains a high-quality, well-regulated market, but its investable universe is structurally concentrated, with financials and property-related segments forming the backbone of index earnings. This has historically produced periods of strong income alongside more modest long-term earnings growth and episodic “lost decades” when macro tailwinds fade.
When investors overweight recent winners, they are concentrating into a narrower set of sector and factor risks. In Singapore’s case, additional home bias typically means greater sensitivity to bank margins, regional credit conditions, and property funding cycles, while reducing participation in global technology and innovation earnings. The opportunity cost of this concentration is often underappreciated, particularly given that much of the past two decades of global earnings growth has come from sectors under-represented in smaller domestic markets.
This paper is by no means an exhaustive analysis of the Singapore equity market. Rather, it offers a practical framework for understanding how market structure, earnings breadth, and valuation starting points interact to shape long-term outcomes. Tactical tilts and measured home bias can be appropriate in specific circumstances, but they should be deliberate and proportionate. For long-term investors, the critical mission is to build a portfolio resilient enough to navigate the next decade of uncertainty. On that front, the case for disciplined global diversification remains firmly intact.
The writer of this article, Glenn Tan, is Portfolio Manager at Providend Ltd, Southeast Asia’s first fee-only comprehensive wealth advisory firm. He is also a CFA Charterholder and a Certified Financial Risk Manager (FRM).
For more related resources, check out:
1. Active Investing That Adds Value to the Client
2. Long Term Risk Premiums and Expected Returns: Evidence From US and China
3. Here’s Why We Charge a Higher Fee Than Robos
Download our Investment eBook titled “A More Reliable Way to Get Enough Investment Returns: Even During Times of Market Uncertainty” here.
With a minefield of financial misinformation out there, we promise to be a safe pair of hands and a second pair of eyes to help you avoid costly financial mistakes. Learn more about our investment philosophy here.
We do not charge a fee at the first consultation meeting. If you would like an honest second opinion on your current estate plan, investment portfolio, financial and/or retirement plan, make an appointment with us today.