At Providend, we adopt an investment strategy that is market evidence-based. Our investment philosophy and approach must:
- Be able to deliver long-term returns that thrive at meeting the objectives of our clients with the highest probabilities given the prevailing financial market conditions.
- Have a risk level that clients are comfortable with.
- Come at a cost that is reasonable and sensible.
For us to implement the philosophy, we require a framework to assess the various asset classes and investment products that are available to us. The concept that holds the framework together is “evidence”. We expect our investment implementation to be as data-driven as possible, to create an investment recommendation that is robust, well-researched (both quantitative and qualitative), and suitable (it has to make sense to advisers and clients so they can understand, explain, and accept it).
In this evidence-based framework, we have a few principles we follow. The first principle is that the returns from the investment must make sense on an economic basis. In other words, we try our best to answer the questions: What are the economic reasons for a particular asset to produce returns? i.e., Where are the returns coming from?
In a capitalist, market-based economy, we can expect that investments as an asset class will provide returns comparable to the economic value they are providing over time, and the returns can be measured by the excess returns above the risk-free rate.
Using this as the starting point, we can assess an asset class or investment against its risk to have an idea of how reasonable the expected return of the investment can be. It also gives us a framework to think about data to avoid falling into a correlation = causation trap or data mining.
For example, we expect stocks to provide higher expected returns than bonds. This is rooted in the foundation of how companies operate and pay back stock and bond investors. Stock investors’ returns are paid by the company only after the bond investors’ return has been paid, and bond investors’ claim on the company’s assets also has priority over stock investors. Therefore, stock investors’ returns are of higher risk than bond investors. So, it is natural for stock investors to receive higher returns over time.
We discussed the philosophy in past articles. In this short article, I would like to provide a quick refresh that these long-term risks and relationships do hold with up-to-date data from two seemingly very different markets, the US and China.
These days, it is hard to not read about US or China stocks and bond markets in newspapers or on TV; after all, the US and China are the two largest economies globally, and their stocks and bonds markets are also the two largest.
Table 1: US and China GDP, Stock Market Size and Bond Market Size
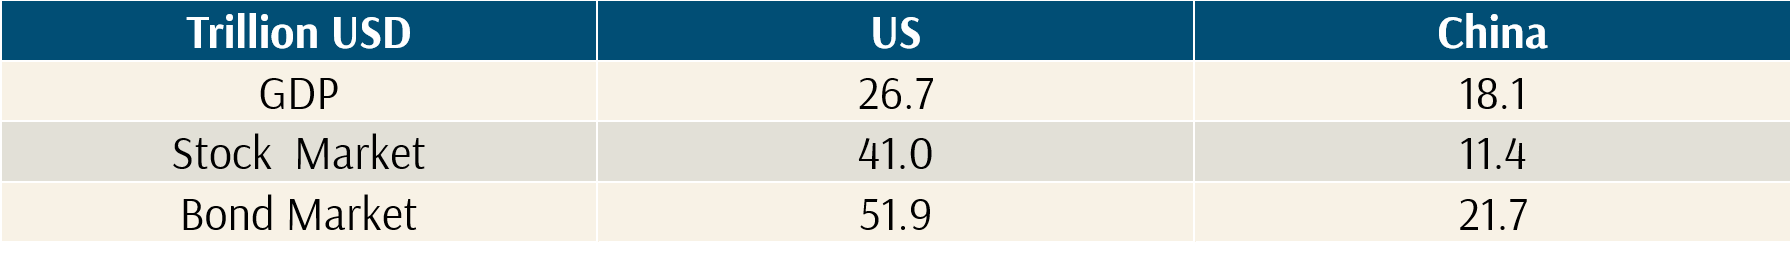
Source: Author
There are many differences between the two countries. For example, the US stock market is not only the largest but also has the longest history and is widely considered to be the most advanced, while the Chinese listed stock market only came into existence in the 1990s and is still considered part of the emerging market category.
There have also been many differences in their approaches to managing the country and developing its economy, respectively. The natural question to ask is whether these differences we observe will carry through to the returns and risks of major asset classes in those two countries. In other words, would the market-based asset pricing mechanism work similarly in these two countries at the asset class levels? And further, should we use very different approaches in investing in these countries?
To answer these questions, we took a look at the historical returns from the US (1926-2023) and China (2004-2023). The Chinese capital market data before 2004 is not consistent enough to do the asset class comparison, so we used the longest history possible.
The following charts, 1 and 2, show the decomposition of each asset class based on the risk components in the US and China. For example, short-term bond returns can be represented by the sum of inflation and the real risk-free rate. Table 2 summarises the numbers in a much easier-to-compare table format.
Chart 1: China Risk Premium
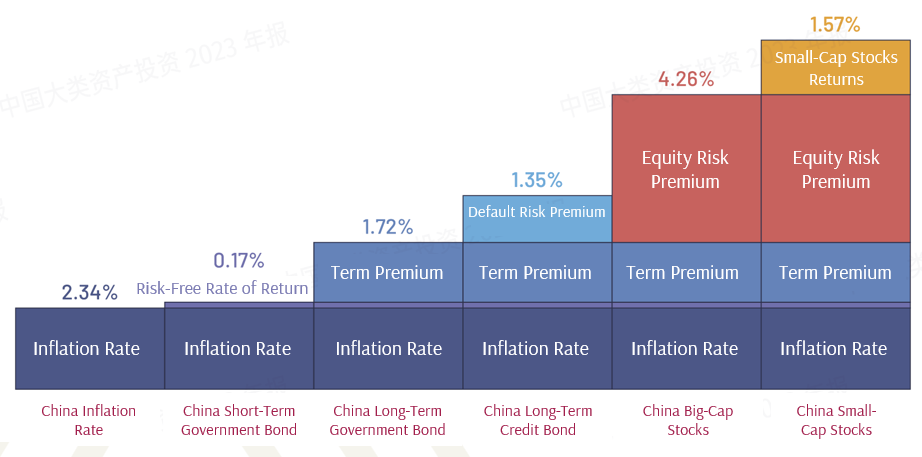
Source: SBBI China Yearbook 2023
Chart 2: US Risk Premium
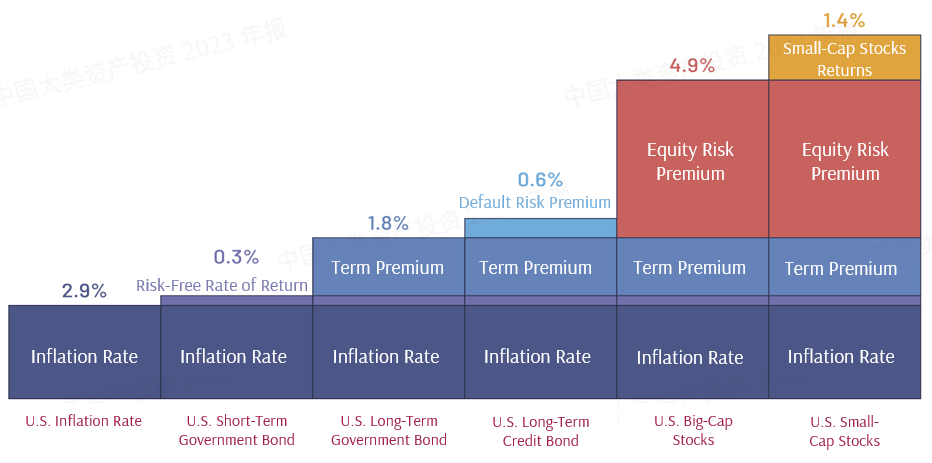
Source: SBBI China Yearbook 2023
Table 2: Comparison of the Risk Premium
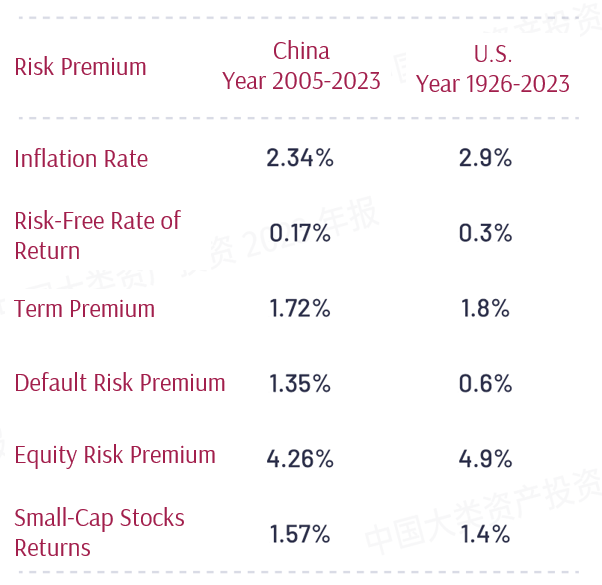
Source: SBBI China Yearbook 2023
By comparing the risk premiums between the Chinese and US markets, we can observe that despite many differences between the two markets, the realised long-term average risk premiums are shockingly similar. Investors investing in the Chinese and US markets have a high degree of comparability in asset pricing across major asset classes.
These numbers show that despite the differences, the market-oriented asset pricing mechanism prevails in both the US—an advanced economy—as well as in China—an emerging economy. And the long-term risk relationships among major asset classes hold up pretty well. The evidence supports the investment philosophy and approach Providend employs to construct investment portfolios.
This is an original article written by Dr Peng Chen, Senior Advisor and Director at Providend, Southeast Asia’s first fee-only comprehensive wealth advisory firm.
To ensure a good investment experience, Providend is committed to delivering reliable returns, prioritising this over maximising returns and taking unnecessary risks that do not meet your needs. You can learn more about our purpose-driven approach towards Wealth Management and Investment Management.
We do not charge a fee at the first consultation meeting. If you would like an honest second opinion on your current investment portfolio, financial and/or retirement plan, make an appointment with us today.