People always tell me that the financial services industry is an exciting industry to be in. Every day, either in the papers, on TV, radio or on social media, analysts will predict what will happen to the markets. Even non-professionals join in this game of guessing. In the latest run-up to where the markets will be headed, investors were using the yield curve to foretell the future of the stock markets. So, what exactly is the yield curve and how is it used to tell the future of the stock markets?
The yield curve is basically a chart of U.S. government bonds of different maturities ranging from three months to thirty years. Normally, because bonds with shorter maturities have lower yields than bonds with longer maturities (just like fixed deposits with shorter maturities give a lower interest than fixed deposits with longer maturities), if you plot a chart from shorter to longer maturities, then the chart has an upward slope from left to right. But when bonds with shorter maturities have higher yields than those with longer maturities, we say that the yield curve is inverted (see chart 1).
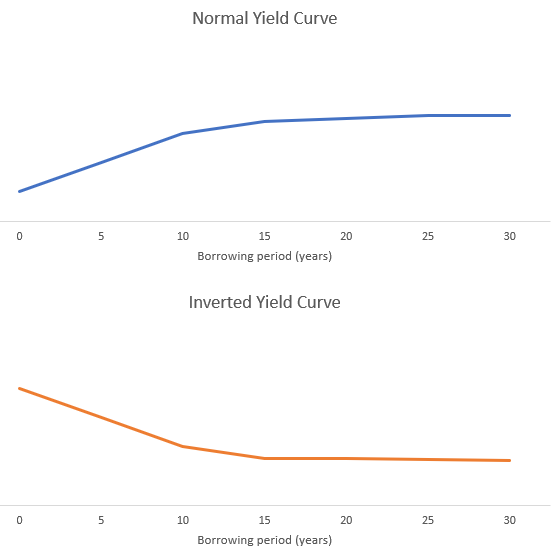
Chart 1
Why would a yield curve invert? You see, from the bond investor’s point of view, the price of long-term bonds is driven by the economic outlook. When the economic outlook dims, inflation expectations are lowered making bonds attractive (as bond coupon rates are fixed, higher inflation is bad for bonds and vice-versa). So, investors will buy these bonds thus pushing up the bond price and pushing down its yields (when the price of an asset goes up, the return, or yield, falls). From the stock investor’s perspective, if he is expecting slower economic growth and stock prices to fall as a result, he will rush to buy longer-dated bonds to protect his capital. When that happens, it drives prices of the longer-dated bonds up and thus yields fall. So, whether you are a bond or stock investor, the yield curve inverting signals a possible recession and investors use it to predict a stock market crash.
And on 22 March 2019, the yield curve inverted when the 3-month U.S. Treasury bill yield was higher than the 10-year U.S. government bond yield. It stayed inverted for 5 days.
But what is the track record of using the yield curve as a prediction tool?
The historical data tells us two things. First, that yield curve inversion has not been reliable for predicting stock market crashes (defined as a decline of 20% or more, a.k.a. a bear market). Out of the 8 times the yield curve inverted from 1976 to 2018, the stock market only crashed 3 times within 2 years of the yield curve inverting. Second, regardless of whether the yield curve inverted and/or whether the market crashed, the stock market rose in the long run.
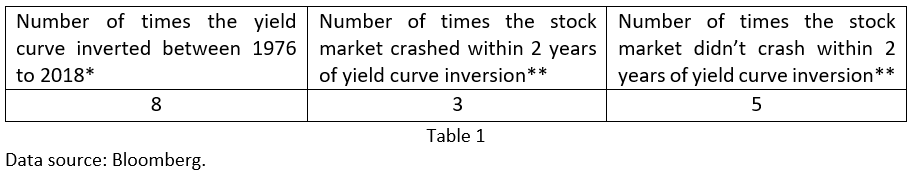
* Most investors use the 2-year government bond yield as the short-dated bond, and the 10-year government bond as the longer-dated bond to observe yield curve inversion. The number excludes inversions with negative yield curve spreads that do not exceed -0.10% before turning positive again; and where the yield curve spread turns positive again (with a spread of less than 0.10%) before inverting, the subsequent inversion is also excluded. This removes a large number of inversions that may be deemed to be insignificant.
**A stock market crash is defined in this instance as a bear market—meaning a decline of 20% or more.
So, does that mean that tools like the yield curve and economic data are useless? To say so would be to make the right observation but with the wrong conclusion. What do I mean? You see, all of us have a financial equation in our lives, one part of which is short term and another part is long term.
The short-term part is your income minus your expenses, or your surplus. How much surplus you save in the short term is the result of your financial planning decisions.
The long-term part is how you grow your short-term surpluses into a future nest egg through compounding returns, and this is your long-term investment strategy.
The thing is, many people do not realise that tools and data that tell us how the economy might be in the short-term are meant to help us make short-term financial planning decisions (on income minus expenses) and not influence our long-term investment strategy (on accumulating towards our goal). They are using the right tools for the wrong purpose!
Scores of data tell us that throughout and despite the recessions, geopolitical situations or natural disasters that happen from time to time, stock markets always rise in the long run. This is because the one thing that drives long-term stock market returns is earnings. Earnings are driven by demand and demand is driven by population growth. And the fact is, world population growth is increasing. So, if you ignore short-term noises and stay invested for the long run, you will get the returns you need. But to do that, you must make sure that you get your financial planning right. If data and tools tell you that there might be a recession, make good financial planning decisions such as:
- Protect your income – this is perhaps not a good time to change jobs.
- Be prudent in your expenses – this may not be a good time to buy big-ticket items or to take huge loans
- Ensure you have an emergency fund – have at least 6 months of your expenses in cash/near cash instruments
- Lower your expenses further if possible – so that if you lose your job and take one with lower pay, you can better cope with it
- Lower your expenses further to build up cash, or don’t spend the bonus you just received – so that if the market really crashed, you can invest even more when stocks are cheap.
In the course of my career of more than two decades, I have learnt that to attempt to guess where the markets are going and try to time it, is futile. We should rather invest based on solid evidence that spans across markets and over time. These sets of evidence tell us that to have a successful investment experience, you should diversify your investment across securities, asset classes, and markets. Use low-cost instruments to execute your strategy and stay invested for the long haul. Do not change your long-term investment strategy just because of occasional noises. To use short-term information to make long-term decisions would really be unwise. I know this sounds boring. But if you want excitement, go to the casino instead.
The writer, Christopher Tan, is Chief Executive Officer of Providend, a Fee-Only Wealth Advisory Firm. Besides being financially trained, he is also an Associate Certified Coach with the International Coach Federation. The edited version has been published in The Sunday Times on 21st April 2019.
For more related resources, check out:
1. Thoughts & Reflections From Hong Kong: Why Is Investing So Difficult?
2. How To Get Passive Income From Your Accumulating Funds
3. Investing Is Not Just About Returns
We do not charge a fee at the first consultation meeting. If you would like an honest second opinion on your current investment portfolio, financial and/or retirement plan, make an appointment with us today.